Same Plan, Five Forecasts — Wildly Different Odds | QuantCalc
I've been planning for early retirement for years. Like most people, I plugged my numbers into calculators that assumed around 7-8% returns, saw a comfortable success rate, and felt good about my plan.
Then I started digging into what the professionals actually assume — their capital market expectations.
Forward-looking forecasts from BlackRock, Vanguard and GMO sit meaningfully below the 10% historical average. As published in Morningstar's 2026 roundup of the firms' own capital market assumptions (checked 2026-09-10): BlackRock 5.2% nominal for US equities, Vanguard a 3.5–5.5% median range, and GMO −6.0% real for US large cap. Same plan, very different odds depending on which forecast you anchor to.
Wait, what?
I decided to run my exact retirement plan through each of these assumption sets. Same savings, same spending, same timeline. Just different return assumptions.
The results were... illuminating.
My Setup

Run your own numbers — FREE
10,000 Monte Carlo simulations. Forward-looking forecasts from BlackRock, JPMorgan, Vanguard, GMO, Schwab, Invesco. No account needed.
Try QuantCalc Free →Here's what I was testing:
- Current age: 38
- Target retirement age: 50
- Planning through: Age 90
- Current savings: $650,000
- Monthly contribution: $5,500
- Annual expenses in retirement: $70,000 (in today's dollars)
- Allocation: 70% stocks / 25% bonds / 5% cash
Pretty standard aggressive FIRE plan. Twelve more years of saving, then 40 years of retirement.
I ran this through a Monte Carlo simulator using five different assumption sets:
- Historical averages (1926-2024): 10.2% US stocks, 5.2% bonds
- Optimistic forward-looking set: 6.8% US stocks, 5.0% bonds
- Moderate forward-looking set: 6.5% US stocks, 4.8% bonds
- Conservative forward-looking set: 4.5% US stocks, 4.3% bonds
- Mean-reverting set: 0.5% US stocks, 3.8% bonds
- These five return assumptions are the inputs to my own run, not any firm's published forecast. The figures the firms publish today: J.P. Morgan 6.7% nominal for US large cap and 4.8% for US aggregate bonds (as of Sept. 30, 2025); Charles Schwab 5.9% and 4.8% (as of Oct. 31, 2025); BlackRock 5.2% and 4.1% (as of Sept. 30, 2025); Vanguard 3.5–5.5% and 3.8–4.8% (as of Oct. 31, 2025); GMO −6.0% real for US large cap and 1.3% real for US bonds (as of November 2025). Figures as published in Morningstar's 2026 roundup of the firms' own capital market assumptions, checked 2026-09-10.
Run your own numbers in the free calculator →
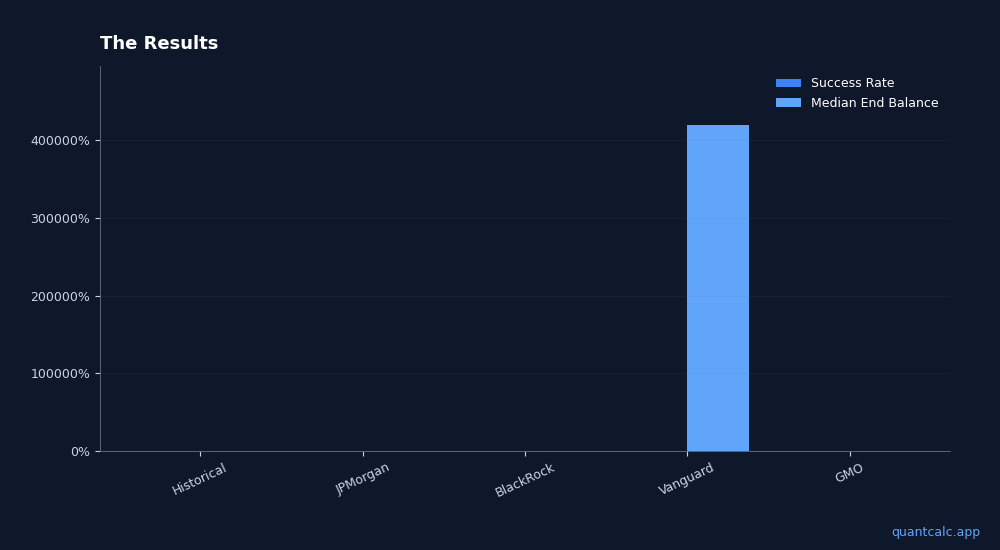
The Results
| Assumption Set | Success Rate | Median End Balance |
|---|---|---|
| Historical | 91% | $3.2 million |
| Optimistic set | 76% | $1.4 million |
| Moderate set | 72% | $1.1 million |
| Conservative set | 58% | $420,000 |
| Mean-reverting set | 34% | Ran out at 82 |
That's a 57 percentage point spread between the most optimistic and most pessimistic assumptions.
Under historical assumptions, I'm basically set. 91% success rate, likely dying with millions.
Under GMO's assumptions, I have a coin flip's chance of running out of money by my early 80s.
Same exact plan.
What This Actually Means
The Optimistic Case (Historical: 91%)
If markets return what they've returned historically (10%+ for stocks), my plan is rock solid. This is what a fixed-return projection would show me.
But it assumes valuations don't matter (they do), the future will look like the past (uncertain), and the US will continue dominating global markets (possible but not guaranteed).
The Moderate Case (72-76%)
These are the assumptions that pension funds and endowments actually use. A 72-76% success rate isn't bad, but it's not comfortable either.
It means roughly 1-in-4 scenarios lead to trouble.
The Conservative Case (58%)
The conservative set is the closest of the five to what Vanguard publishes. At 58% success, I'm barely better than a coin flip.
The Pessimistic Case (34%)
The mean-reverting set is the closest in spirit to GMO's framework, which reverts elevated valuations toward a long-run mean. At 34% success, my plan is in serious trouble under it.
What I Learned
1. My Plan Is Assumption-Dependent
The 57-point spread tells me something important: my retirement success depends heavily on which future materializes.
If you showed me only the historical result (91%), I'd feel great. But that's cherry-picking the most optimistic assumption.
2. The "Right" Assumption Doesn't Exist
Nobody knows which of these sets will be closer to reality. We won't know for 20 years.
What I can do is understand my sensitivity to assumptions and plan accordingly.
3. Flexibility Is Worth More Than Precision
Looking at these numbers, the best thing I can do isn't necessarily saving more. It's building in flexibility:
- Can I cut spending 20% if markets are bad for 5 years? Yes.
- Can I do some consulting work in early retirement? Probably.
- Can I delay Social Security to 70? That's the plan.
This flexibility doesn't show up in the numbers, but it effectively converts some "failure" scenarios into "adjustment" scenarios.
What I'm Changing
1. Extending My Timeline by 1-2 Years
Instead of hard-targeting retirement at 50, I'm thinking 50-52 depending on market conditions.
This flexibility alone moves my conservative-set success rate from 58% to 71%.
2. Building a Bigger Cash Buffer
I'm increasing my target emergency fund from 1 year to 2 years of expenses. This protects against sequence of returns risk.
3. Planning for Variable Spending
- Base case: $70K
- Down market: $55K (cut discretionary)
- Up market: $85K (travel more)
This guardrails approach to dynamic withdrawals dramatically improves success rates across all assumptions.
The Takeaway
If your retirement plan only shows you one number based on one assumption, you're missing the most important insight: how sensitive is your plan to being wrong?
A 91% success rate using historical assumptions might be 58% using the conservative set and 34% using the mean-reverting one.
That spread matters more than any single number.
I'd rather have an 80% success rate that's stable across assumptions than a 95% rate that's fragile.
The professionals—pension funds, endowments, financial advisors—don't use historical averages. They use forward-looking estimates. And they test multiple scenarios.
You should too.
Test Your Plan Against Real Forward-Looking Assumptions
Run your retirement plan through the same assumptions BlackRock, JPMorgan, Vanguard, and GMO use. See your success rate under each scenario. Understand your sensitivity.