What Are Capital Market Expectations? A Plain-English Guide
Every year, the world's largest asset managers—BlackRock, JPMorgan, Vanguard, and others—publish documents predicting what they think stocks, bonds, and other assets will return over the next decade or two.
These predictions are called Capital Market Expectations, or CMEs.
If you're planning for retirement, these numbers matter more than you might think. They're the assumptions that professional financial planners use. They're what pension funds use to decide if they can meet their obligations. And they're almost certainly different from the numbers your retirement calculator is using.
Let's break down what CMEs are, where they come from, and why you should care.
What Exactly Are Capital Market Expectations?
Run your own numbers — FREE
10,000 Monte Carlo simulations. Forward-looking forecasts from BlackRock, JPMorgan, Vanguard, GMO, Schwab, Invesco. No account needed.
Try QuantCalc Free →Capital Market Expectations are forward-looking estimates of:
- Expected returns for different asset classes (stocks, bonds, real estate, etc.)
- Expected volatility (how much those returns might bounce around)
- Correlations between asset classes (how they move relative to each other)
Unlike historical averages, which just look at what happened in the past, CMEs try to predict what will happen in the future based on current conditions.
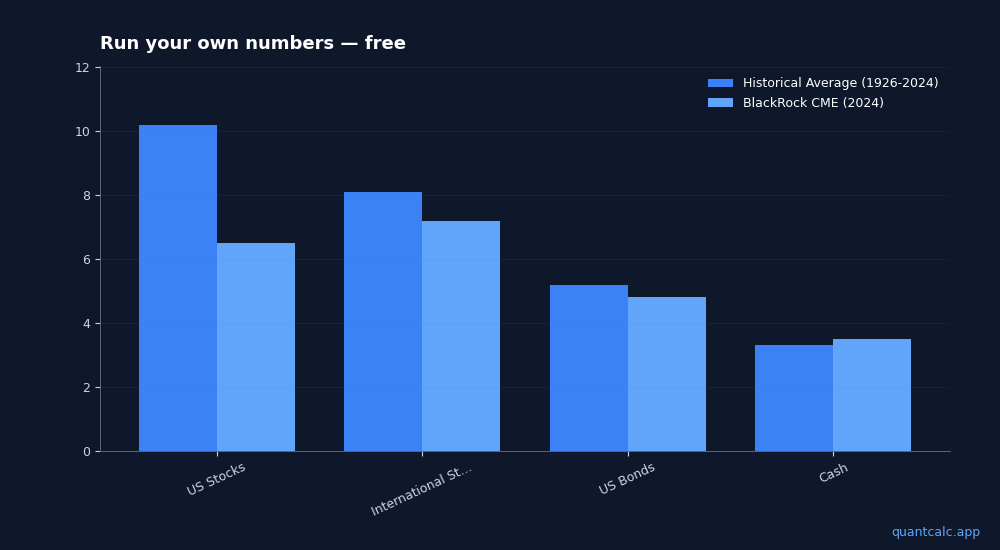
Here's a simple example of the difference:
| Asset Class | Historical Average (1926-2024) | BlackRock CME (2024) |
|---|---|---|
| US Stocks | 10.2% | 6.5% |
| International Stocks | 8.1% | 7.2% |
| US Bonds | 5.2% | 4.8% |
| Cash | 3.3% | 3.5% |
Notice that the forward-looking estimates for stocks are significantly lower than historical averages. That's not pessimism—it's math, which we'll get to shortly.
Who Publishes CMEs?
The major publishers include:
BlackRock - One of the world's largest asset managers. They publish annual Capital Market Assumptions covering 10-20 year horizons. Headline figures are widely reported in financial press (e.g., Morningstar's annual "Experts Forecast Stock and Bond Returns" roundup).
JPMorgan - Their annual LTCMA is one of the most widely cited in the industry. Covers 10-15 year forward estimates.
Vanguard - Known for conservative estimates. Their annual outlook tends to be on the lower end of projections.
GMO - Jeremy Grantham's firm, famous for contrarian (often pessimistic) forecasts based on mean reversion. They publish quarterly 7-year forecasts.
Charles Schwab - Publishes 10-year long-term Capital Market Expectations on their consumer-facing Learn page (schwab.com/learn). Updated annually.
These aren't random guesses. Each firm employs teams of economists, strategists, and quantitative analysts to build these models.
How Are CMEs Calculated?
While each firm has its own methodology, most CMEs are built on a common framework called the building block approach:
For Stocks:
Expected Return = Dividend Yield + Earnings Growth + Valuation Change
Let's break that down:
- Dividend Yield (~1.5% currently for US stocks) - What you get paid just for holding
- Earnings Growth (~4-5% long-term) - How much corporate profits grow
- Valuation Change (-1% to -2% expected) - This is the key difference
That third component is why CMEs are lower than historical returns. Current stock valuations (measured by metrics like CAPE ratio) are historically high. Most models assume valuations will gradually normalize, which creates a headwind to returns.
For Bonds:
Expected Return ≈ Current Yield
Bond math is simpler. If you buy a 10-year Treasury yielding 4.5%, your expected return over the next decade is... roughly 4.5%. There's not much mystery.
Why Should You Care?
If you're using a retirement calculator that assumes 10% stock returns, you're probably overestimating your future wealth.
Consider a 30-year retirement projection:
| Assumption | $500K grows to... |
|---|---|
| 10% returns (historical) | $8.7 million |
| 7% returns (moderate CME) | $3.8 million |
| 5% returns (conservative CME) | $2.2 million |
Same starting point. Same timeframe. Wildly different outcomes.
Which assumption is "right"? Nobody knows. But if your retirement plan only works under the optimistic assumption, you might want to know that.
What the Pros Actually Use
Here's something most retail investors don't realize: professional financial planners don't use historical averages.
When a pension fund calculates whether it can meet its obligations, it uses CMEs. When an endowment plans its spending rate, it uses CMEs. When a financial advisor builds a plan using professional-grade planning software, the default assumptions are typically CME-based.
The tools available to retail investors (the free calculators you find online) often use historical averages because they're simpler to explain. Understanding why Monte Carlo simulation beats fixed-return calculators is the first step toward professional-grade planning.
The Problem With Using Just One CME
Different firms have meaningfully different views:
| Source | US Stock Expected Return |
|---|---|
| Historical Average | 10.2% |
| JPMorgan 2024 | 6.8% |
| BlackRock 2024 | 6.5% |
| Vanguard 2024 | 4.5% |
| GMO Q4 2024 | 0.5% |
That's a huge range. GMO thinks US stocks are so overvalued that they'll barely beat inflation over the next 7 years. JPMorgan is more sanguine.
Who's right? We won't know for a decade.
The prudent approach isn't to pick one and hope—it's to understand how sensitive your plan is to these assumptions.
How to Use CMEs in Your Planning
Option 1: Use Conservative Estimates
If you want a single number, use something toward the lower end of published estimates. A 5-6% stock return assumption builds in a margin of safety.
Option 2: Test Multiple Scenarios
The better approach is to run your retirement plan through multiple assumption sets:
- What's my success rate using historical averages?
- What about using BlackRock's estimates?
- What about using GMO's pessimistic forecast?
If your plan works under all of them, you're in good shape. If it only works under the optimistic ones, you need a bigger cushion.
The Bottom Line
Capital Market Expectations represent the informed view of the world's largest asset managers on what future returns will look like. They're not perfect predictions—nobody can predict the market—but they're more grounded in current conditions than simple historical extrapolation.
Key takeaways:
- CMEs are generally lower than historical averages for stocks, primarily due to high current valuations
- Different firms disagree significantly, with estimates ranging from 0.5% to 7%+ for US stocks
- Professional planners use CMEs, not historical averages
- Testing your plan against multiple assumptions reveals how robust it actually is
Test Your Retirement Plan Against Real CME Data
Run your retirement plan against published CME data from BlackRock, JPMorgan, Vanguard, and GMO. See how sensitive your success rate is to these assumptions.
Frequently Asked Questions
What are capital market expectations (CMAs)?
Capital market expectations are forward-looking return, risk, and correlation forecasts published by major asset managers. Firms like BlackRock, JPMorgan, Vanguard, Schwab, and GMO publish annual or semi-annual 10-year and 20-year forecasts. These are used by institutional investors to set portfolio strategy and are generally more reliable than simply projecting historical returns forward.
Why do capital market expectations matter for retirement planning?
Historical US equity returns averaged about 10% nominal, but current published forecasts project 4-7% for the next decade. Planning with historical averages when institutions expect lower returns creates a false sense of security. Using forward-looking CMAs in Monte Carlo simulation gives more realistic success probabilities for your retirement plan.
Frequently Asked Questions
Capital market expectations are forward-looking return, risk, and correlation forecasts published by major asset managers. Firms like BlackRock, JPMorgan, Vanguard, Schwab, and GMO publish annual or semi-annual 10-year and 20-year forecasts. These are used by institutional investors to set portfolio strategy and are generally more reliable than simply projecting historical returns forward.
Historical US equity returns averaged about 10% nominal, but current published forecasts project 4-7% for the next decade. Planning with historical averages when institutions expect lower returns creates a false sense of security. Using forward-looking CMAs in Monte Carlo simulation gives more realistic success probabilities for your retirement plan.