Monte Carlo vs Fixed Return Calculators: Which Should...
You plug your numbers into a retirement calculator. It tells you: "You'll have $2.3 million at age 65."
Great. But will you really?
That number assumes markets return exactly 7% every single year for the next 30 years. Markets don't work that way. Some years they're up 25%. Some years they're down 35%. The order matters enormously—especially once you start withdrawing money.
This is where Monte Carlo simulation comes in.
How Fixed Return Calculators Work
Run your own numbers — FREE
10,000 Monte Carlo simulations. Forward-looking forecasts from BlackRock, JPMorgan, Vanguard, GMO, Schwab, Invesco. No account needed.
Try QuantCalc Free →A fixed return calculator does simple math:
Year 1: $100,000 × 1.07 = $107,000
Year 2: $107,000 × 1.07 = $114,490
Year 3: $114,490 × 1.07 = $122,504
... and so on
Every year, your portfolio grows by exactly 7%. It's deterministic—plug in the same inputs, get the same output.
Pros:
- Simple to understand
- Easy to calculate
- Gives a clear target number
Cons:
- Markets never return exactly 7% every year
- Completely ignores volatility and sequence risk
- Creates false precision
- Can lead to dangerous overconfidence
How Monte Carlo Simulation Works
Instead of assuming one outcome, Monte Carlo simulation runs your retirement plan through hundreds or thousands of different possible futures.
Each simulation:
- Randomly generates a sequence of annual returns (based on historical distribution or forward estimates)
- Applies those returns to your portfolio year by year
- Accounts for your contributions (before retirement) and withdrawals (after)
- Tracks whether you run out of money
Run 1,000 simulations and you might get:
- 780 scenarios where your money lasted
- 220 scenarios where you ran out
That gives you a 78% success rate—a probability, not a false certainty.
A Simple Example
Let's say you're retiring with $1 million and plan to withdraw $40,000/year (4% rule).
Fixed Return Calculator (7% average):
- Year 30: $3.2 million remaining
- Verdict: You're fine!
Monte Carlo Simulation (7% average, 15% volatility):
- 85% of simulations: Money lasted 30 years
- 15% of simulations: Ran out before year 30
- Verdict: Probably fine, but 15% risk of failure
Same average return. Very different insights.
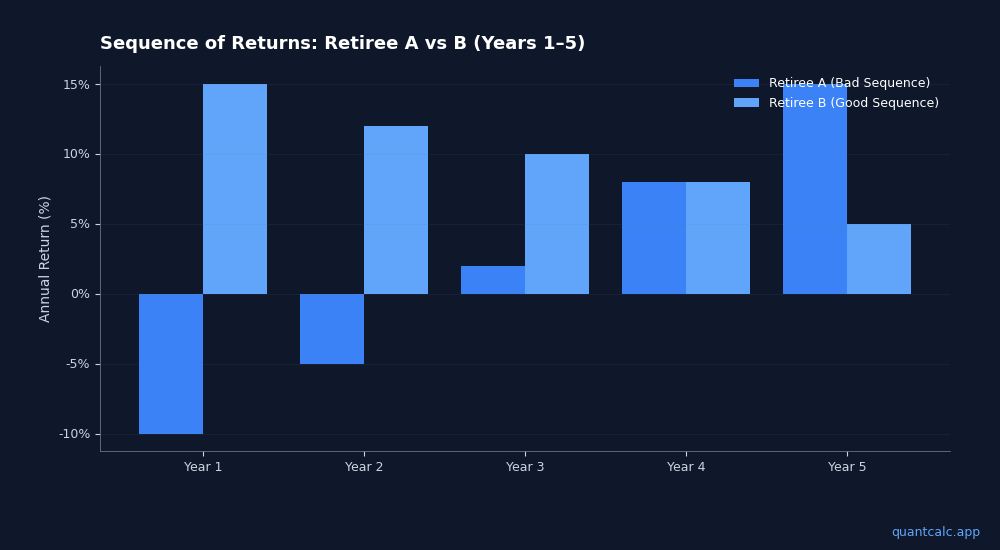
Why Sequence of Returns Matters
This is the critical insight that fixed return calculators completely miss.
Imagine two retirees, both starting with $1 million, both withdrawing $50,000/year, both experiencing an average 7% return over 20 years.
Retiree A: Bad returns early
- Years 1-5: -10%, -5%, +2%, +8%, +15%
- Then average returns
Retiree B: Good returns early
- Years 1-5: +15%, +12%, +10%, +8%, +5%
- Then average returns
Despite the same average return, Retiree A might run out of money while Retiree B ends with millions.
Why? Because Retiree A was selling shares at low prices to fund withdrawals. Those shares weren't there to recover when markets bounced back.
This is sequence of returns risk, and it's why Monte Carlo matters.
What Monte Carlo Shows You
1. Success Rate
The percentage of simulations where you didn't run out of money.
- 95%+ = Very safe
- 80-95% = Reasonably safe
- 70-80% = Some risk
- Below 70% = Significant risk
2. Distribution of Outcomes
Not just pass/fail, but the range of where you might end up:
- 90th percentile: Great scenario
- 50th percentile (median): Middle outcome
- 10th percentile: Unlucky but not worst case
3. Confidence Bands
Visual representation of uncertainty over time. The "fan" shape shows how uncertainty grows the further you project.
The Limitations of Monte Carlo
Monte Carlo isn't magic. It has its own issues:
Garbage In, Garbage Out
The simulation is only as good as its assumptions. If you assume 10% returns with 12% volatility, you'll get different results than 6% returns with 18% volatility.
This is why assumption transparency matters. A Monte Carlo result of "92% success rate" is meaningless if you don't know what returns and volatility were assumed.
Historical vs Forward-Looking
Most Monte Carlo tools use historical data. But past performance doesn't guarantee future results. The best approach: run Monte Carlo using different assumption sets (historical, BlackRock, Vanguard, GMO) and see how your success rate changes.
The Real Insight: Sensitivity Analysis
Here's what most people miss: the single most valuable thing Monte Carlo can show you isn't your success rate—it's how sensitive your success rate is to assumptions.
Run your plan with historical returns: 92% success
Run it with BlackRock CME: 78% success
Run it with Vanguard CME: 65% success
Run it with GMO: 48% success
This is exactly what testing your plan against multiple published forecasts looks like in practice.
Now you know something important. Your plan depends heavily on optimistic assumptions. That's not necessarily bad—but you should know it.
The Bottom Line
Fixed return calculators tell you what happens if everything goes exactly as planned.
Monte Carlo tells you what happens across a range of plausible futures.
For a decision as important as retirement, you want the range—not false precision.
Try Monte Carlo With Forward-Looking Assumptions
QuantCalc runs your plan against published CME data from BlackRock, JPMorgan, Vanguard, and GMO, showing you exactly how sensitive your retirement is to different forecasts.
Frequently Asked Questions
What is the difference between Monte Carlo and fixed return retirement calculators?
Fixed return calculators assume the same return every year (e.g., 7% annually), which never happens in reality. Monte Carlo calculators simulate thousands of possible return sequences — including crashes, booms, and everything between — to give you a probability of success. A plan showing 'you will have $2M at 75' with fixed returns might only have a 68% chance of working when tested against realistic market volatility.
Which type of retirement calculator is more accurate?
Monte Carlo simulation is more accurate because it captures sequence of returns risk, the primary threat to retirement plans. A 7% average return over 30 years can produce outcomes ranging from $800K to $4M depending on the ORDER of returns. Monte Carlo reveals this range. For even greater accuracy, use forward-looking published capital market expectations rather than historical averages, since most major asset managers project lower returns for the next decade.
Frequently Asked Questions
Fixed return calculators assume the same return every year (e.g., 7% annually), which never happens in reality. Monte Carlo calculators simulate thousands of possible return sequences — including crashes, booms, and everything between — to give you a probability of success. A plan showing 'you will have $2M at 75' with fixed returns might only have a 68% chance of working when tested against realistic market volatility.
Monte Carlo simulation is more accurate because it captures sequence of returns risk, the primary threat to retirement plans. A 7% average return over 30 years can produce outcomes ranging from $800K to $4M depending on the ORDER of returns. Monte Carlo reveals this range. For even greater accuracy, use forward-looking published capital market expectations rather than historical averages, since most major asset managers project lower returns for the next decade.