Monte Carlo Retirement Calculator: 10K Sims vs 1 Bad Assumption
Monte Carlo simulation runs a retirement plan through thousands of randomized market scenarios — crashes, bull runs, stagflation — and reports the probability the money lasts. Unlike single-rate calculators that assume a steady 7% every year, it captures the order of returns: about 40% of plans that look safe under average assumptions fail when tested against real volatility. A success rate of 85-95% generally indicates a strong plan. Run your own plan at quantcalc.app.
Monte Carlo simulation for retirement planning runs your financial plan through thousands of randomized market scenarios — bull runs, crashes, stagflation — to show the probability your money lasts. Unlike fixed-return calculators that assume a steady 7% annually, Monte Carlo reveals that 40% of plans that look "safe" under average assumptions actually fail when tested against real market volatility.
Is your retirement plan crash-proof?
Stress test your portfolio against 2008, COVID, stagflation, and custom scenarios. Find the exact crash your plan cannot survive.
Free Stress TestMost retirement calculators lie to you. Not intentionally—but by showing you a single outcome based on average returns, they create a false sense of certainty in an uncertain world.
The stock market doesn't return 7% every year. Sometimes it's +30%, sometimes -40%, and the order those returns happen in can make or break your retirement. This is where Monte Carlo simulation comes in—the most sophisticated tool available for retirement planning, and the method used by professional financial advisors managing billions in assets.
This guide will explain exactly what Monte Carlo simulation is, why it matters more than simple calculators, and how to use it to build a retirement plan that actually survives the real world.
The Problem With Traditional Retirement Calculators
Run your own numbers — FREE
10,000 Monte Carlo simulations. Forward-looking forecasts from BlackRock, JPMorgan, Vanguard, GMO, Schwab, Invesco. No account needed.
Try QuantCalc Free →Most retirement calculators work like this:
Inputs:
- Savings: $1,000,000
- Annual spending: $40,000 (4% withdrawal rate)
- Expected return: 7% per year
- Time horizon: 30 years
Output: "You'll have $2.1 million after 30 years. Success!"
The lie: Markets don't return 7% every single year. They return +25% one year, -15% the next, +8% the following year. The average might be 7%, but no single year is ever exactly 7%.
Why Sequence Matters: The Tale of Two Retirees
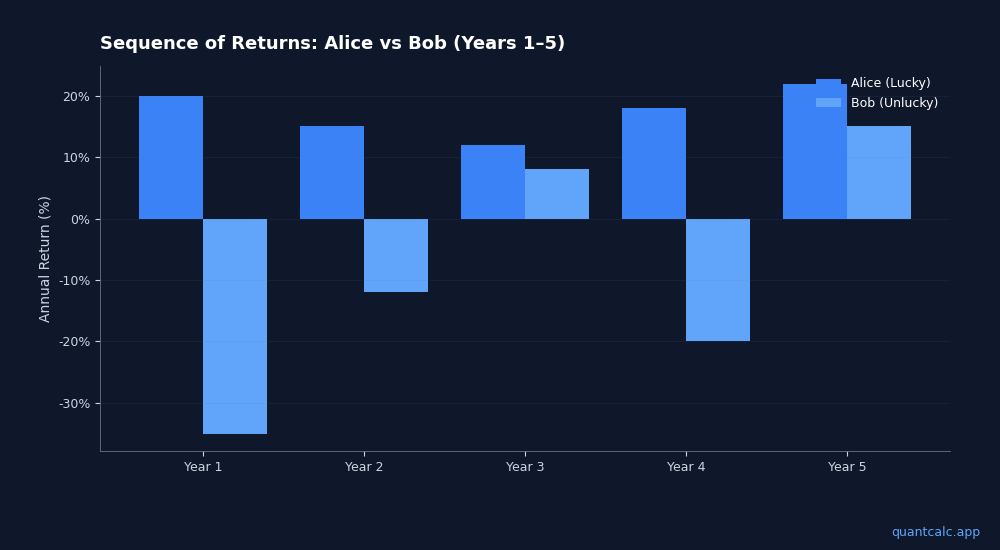
Meet Alice and Bob. Both retire in 2000 with $1 million. Both follow a 4% withdrawal strategy ($40,000/year). Both earn an average 7% return over 30 years.
Alice's sequence (lucky):
- Years 1-5: Strong returns (+20%, +15%, +12%, +18%, +22%)
- Years 6-30: Mix of good and bad years
- Result: Portfolio grows to $2.8 million
Bob's sequence (unlucky):
- Years 1-5: Market crash (-35%, -12%, +8%, -20%, +15%)
- Years 6-30: Strong recovery (same total returns as Alice)
- Result: Portfolio runs out of money in year 23
Same average returns. Same withdrawal strategy. Completely different outcomes.
This is called sequence of returns risk—the risk that bad returns early in retirement deplete your portfolio before markets can recover. Traditional calculators ignore this completely.
(Learn more about sequence of returns risk)
What is Monte Carlo Simulation?
Monte Carlo simulation runs your retirement plan thousands of times, each with a different sequence of market returns, to show you the range of possible outcomes.
How it works:
- Define your inputs:
- Starting portfolio value
- Annual spending needs
- Asset allocation (stocks/bonds mix)
- Time horizon (years in retirement)
- Model market behavior:
- Historical returns and volatility for each asset class
- Correlation between stocks and bonds
- Inflation rates
- Run thousands of simulations:
- Each simulation randomizes the order of returns
- Some simulations get lucky (bull markets early)
- Some get unlucky (crashes early)
- Most fall somewhere in between
- Analyze the results:
- What percentage of simulations succeed (money lasts 30+ years)?
- What's the median outcome?
- What's the worst-case scenario (5th percentile)?
Output: "Based on 10,000 simulations, your plan succeeds in 87% of scenarios. Median ending balance: $1.2M. Worst case (5th percentile): Portfolio depleted in year 26."
This is actionable information. You now know your actual probability of success, not a false certainty.
Understanding Monte Carlo Output: What the Numbers Mean
When you run a Monte Carlo simulation, you'll see several key metrics:
Success Rate (Probability of Success)
The percentage of simulations where your money lasts your entire retirement.
Interpretation:
- 95%+: Very safe (over-saved, possibly leaving money on the table)
- 85-95%: Strong plan with margin for error
- 75-85%: Acceptable for flexible spenders who can cut back in down markets
- 60-75%: Risky—consider working longer, spending less, or more aggressive portfolio
- Below 60%: High failure risk—plan needs major revision
Median Outcome
The "middle" result—half the simulations do better, half do worse.
Why it matters: Even if your success rate is 90%, the median shows you what "typical success" looks like. A median ending balance of $5M vs. $500k tells very different stories about margin for error.
Percentile Bands (10th, 25th, 75th, 90th)
These show the range of outcomes across simulations.
Example:
- 10th percentile: $200k (10% of simulations end with this or less)
- 25th percentile: $600k
- Median (50th): $1.2M
- 75th percentile: $2.5M
- 90th percentile: $4.1M (10% of simulations end with this or more)
Wide bands = high uncertainty. Narrow bands = more predictable outcomes (usually because of heavy bond allocation or short time horizon).
Ruin Probability (Risk of Running Out)
The flip side of success rate. If your success rate is 85%, your ruin probability is 15%.
Why it matters: A 15% chance of running out of money is a 15% chance of catastrophic lifestyle failure. For most people, this is unacceptable—you adjust spending, asset allocation, or retirement timing to reduce ruin risk to 5-10%.
What Makes a Good Monte Carlo Simulation?
Not all Monte Carlo tools are equal. Here's what to look for:
1. Sufficient Simulation Count
- Minimum: 1,000 simulations
- Good: 5,000 simulations
- Best: 10,000+ simulations
More simulations = more accurate probability estimates, especially at the tails (5th/95th percentiles).
2. Realistic Return Assumptions
The simulation should use:
- Historical data: Actual stock and bond returns from 1926-present (or similar long dataset)
- Volatility modeling: Captures that stocks swing wildly year-to-year, bonds less so
- Correlation: Models how stocks and bonds move relative to each other (critical for diversification benefit)
Avoid simulations that use "straight-line returns with noise"—that's not how real markets work.
3. Inflation Adjustments
Your spending increases each year with inflation (otherwise your purchasing power erodes).
Good simulators:
- Adjust annual withdrawals for inflation
- Model inflation variability (it's not exactly 3% every year)
- Use real returns (return minus inflation) or explicitly model inflation
4. Dynamic Withdrawals (Advanced)
Simple simulations assume fixed dollar withdrawals adjusted for inflation. Advanced simulations model flexible spending strategies:
- Guardrails: Increase spending after good market years, decrease after bad years
- Percentage-based: Withdraw X% of current portfolio value (recalculates annually)
- Floor-and-ceiling: Fixed minimum spending (floor) with bonuses in good years (ceiling)
These dynamic strategies dramatically increase success rates for retirees with spending flexibility.
(Learn more about dynamic withdrawal strategies)
5. Tax Awareness (Critical for Accuracy)
Your retirement accounts are taxed differently:
- Traditional IRA/401k: Withdrawals are ordinary income
- Roth IRA: Withdrawals are tax-free
- Taxable brokerage: Capital gains taxes
Monte Carlo simulations that ignore taxes overestimate your available spending by 15-30%. Look for simulators that model:
- Withdrawal sequencing (which account to tap first)
- Tax brackets and marginal rates
- RMD requirements (forced withdrawals starting at age 73)
How to Use Monte Carlo Simulation in Your Planning
Monte Carlo isn't a magic crystal ball—it's a tool for testing "what-if" scenarios.
Scenario 1: Can I Retire Now or Should I Work Another Year?
Test:
- Run simulation retiring today with current savings
- Run simulation retiring in 1 year with 1 extra year of savings
Compare: How much does success rate improve? Is it worth delaying retirement by 1 year to go from 78% to 89% success?
Scenario 2: What's My Safe Withdrawal Rate?
The "4% rule" is a guideline, not a law. Your personal safe withdrawal rate depends on asset allocation, time horizon, and flexibility.
Test:
- Run simulations at 3%, 3.5%, 4%, 4.5%, 5% withdrawal rates
- Find the rate where success drops below your comfort level (e.g., 85%)
Example finding: With your 60/40 portfolio and 30-year horizon, 3.8% gives you 90% success, but 4.5% drops you to 72%. Your personal safe rate: 3.8-4%.
Scenario 3: Should I Hold More Stocks or More Bonds?
Asset allocation is the single biggest driver of risk and return.
Test:
- Run simulations with 30/70, 50/50, 70/30, 90/10 stock/bond allocations
- Compare success rates and percentile outcomes
Typical findings:
- More stocks = higher median outcome BUT higher ruin risk
- More bonds = lower median outcome BUT higher success rate
- Sweet spot for most retirees: 50/50 to 70/30
(Deep dive on asset allocation strategies)
Scenario 4: What If I Delay Social Security?
Claiming Social Security at 62 vs. 70 dramatically changes your lifetime income.
Test:
- Simulation A: Claim at 62, larger portfolio withdrawals to cover spending
- Simulation B: Claim at 70, smaller portfolio withdrawals (Social Security is 76% higher per month)
Compare: Which scenario has higher success rate? What's the crossover age where delaying pays off?
Scenario 5: Can I Afford This One-Time Expense?
Planning a $50,000 kitchen remodel in year 5 of retirement?
Test:
- Baseline simulation (no remodel)
- Scenario simulation (withdraw extra $50k in year 5)
Compare: How much does success rate drop? Is it worth it?
Limitations of Monte Carlo Simulation
Monte Carlo is powerful but not perfect. Understand its limitations:
1. Past Performance ≠ Future Results
Simulations use historical return data. If the next 30 years are structurally different (lower growth, higher inflation, different correlations), the simulation could be wrong.
Mitigation: Use conservative assumptions. If historical stock returns averaged 10%, assume 7-8% going forward.
2. Black Swans Aren't Fully Captured
Historical data includes crashes (1929, 2000, 2008), but the next crisis might be worse or different in character (e.g., prolonged stagflation, currency crisis).
Mitigation: Stress-test your plan with "catastrophic" scenarios (50% market drop, 10 years of flat returns, etc.) to see how resilient you are.
3. Behavioral Risk Isn't Modeled
Simulations assume you stick to your plan. Real humans panic-sell in crashes, chase returns in bubbles, and overspend when times are good.
Mitigation: Build in behavioral buffers. If the simulation says 4.5% is "safe," withdraw 4% to leave margin for your own inevitable mistakes.
4. Longevity Uncertainty
How long will you live? Simulations typically assume 30 years, but you might live 40. Or 20.
Mitigation: Run simulations for multiple time horizons (25, 30, 35, 40 years) to see how much longevity risk you're taking.
Why Monte Carlo Beats Every Other Method
Why better than the "4% rule"?
The 4% rule is based on a single historical period (1926-1995). Monte Carlo uses the full range of historical sequences and can adapt to your personal situation (spending flexibility, asset allocation, Social Security timing).
Why better than simple projection calculators?
Simple calculators show one outcome (usually optimistic). Monte Carlo shows the distribution of outcomes—you see both the upside and the downside.
Why better than "hope for the best"?
Hope is not a strategy. Monte Carlo quantifies your risk so you can make informed trade-offs (work longer, spend less, adjust allocation).
How to Get Started With Monte Carlo Planning
Step 1: Gather your data
- Total portfolio value (all accounts combined)
- Asset allocation (% in stocks, bonds, cash)
- Annual spending needs (current or planned)
- Other income (Social Security, pensions, rental income)
- Time horizon (age now vs. expected longevity)
Step 2: Choose your tool
- Free tools: Historical backtesting tools, Flexible Retirement Planner
- Professional tools: eMoney, MoneyGuidePro (requires financial advisor)
- Best-in-class free tool: QuantCalc—runs up to 10,000 simulations, includes forward-looking forecasts (BlackRock, JPMorgan, Schwab, and others), tax-aware modeling, and portfolio optimization
Step 3: Run your baseline scenario
See where you stand today with no changes.
Step 4: Test alternatives
Adjust one variable at a time (spending, allocation, retirement date) to see what moves the needle.
Step 5: Build your plan
Choose the scenario that balances success probability with lifestyle goals. Aim for 85%+ success rate for rigid spending, 75%+ for flexible spenders.
Step 6: Review annually
Rerun your simulation each year with updated portfolio values and market conditions. Adjust spending or allocation if success rate drops below your threshold.
The Bottom Line
Monte Carlo simulation is the difference between guessing and knowing. It transforms retirement planning from "I hope this works" to "I have an 87% probability of success, and here's what I'll do in the 13% of scenarios where it doesn't."
Professional financial advisors use Monte Carlo for every client. You should too.
Ready to see your real probability of success? Run a Monte Carlo simulation with QuantCalc—free for up to 100 simulations, or upgrade to PRO for 10,000 simulations and forward-looking forecast data.
Frequently Asked Questions
What is a Monte Carlo simulation for retirement planning?
A Monte Carlo simulation runs thousands of randomized market scenarios to estimate how likely your retirement savings will last. Instead of assuming a fixed 7% return, it models the full range of possible outcomes — including crashes, recessions, and booms — giving you a probability of success rather than a single number.
How many Monte Carlo simulations do I need for accurate results?
At minimum, 1,000 simulations provide reasonable estimates. For statistically robust results, 5,000-10,000 simulations are recommended. More simulations reduce sampling error and give more stable probability estimates, especially for tail-risk scenarios like prolonged bear markets.
Is Monte Carlo simulation better than the 4% rule?
Monte Carlo simulation is more comprehensive than the 4% rule because it accounts for sequence-of-returns risk, variable market conditions, and different asset allocations. The 4% rule assumes a fixed withdrawal rate based on historical worst cases, while Monte Carlo shows the full probability distribution of outcomes across thousands of scenarios.
What is a good Monte Carlo retirement success rate?
Most financial planners target 80-95% success probability. Below 80% suggests your plan is underfunded or too aggressive. Above 95% may mean you are being overly conservative and could spend more. The right number depends on your flexibility — can you reduce spending in a downturn?
How does Monte Carlo handle market crashes in retirement?
Monte Carlo naturally models crash scenarios because it randomizes returns across the full historical distribution. Some simulations will include sequences of negative returns early in retirement (the most dangerous scenario). This is called sequence-of-returns risk, and it is the primary advantage of Monte Carlo over simple average-return projections.
Can I run a Monte Carlo simulation for free?
Yes. QuantCalc at quantcalc.app offers 50 free Monte Carlo simulations with basic features. For deeper analysis — 10,000 simulations, portfolio optimization, published forecast comparisons, and stress testing — a PRO upgrade is available for a one-time $99 lifetime fee.
Further Reading:
- Sequence of Returns Risk: What It Is and How to Protect Your Retirement
- Safe Withdrawal Rates in 2026: What the Research Really Says
- How to Use Monte Carlo Simulation to Plan Your Retirement
- Tax-Efficient Withdrawal Strategies for Early Retirees
- ACA Subsidy Cliff Calculator: Free Tool to Check Your Risk
- Stress Test Your Retirement Plan Against Crashes
Frequently Asked Questions
A Monte Carlo simulation runs thousands of randomized market scenarios to estimate how likely your retirement savings will last. Instead of assuming a fixed 7% return, it models the full range of possible outcomes — including crashes, recessions, and booms — giving you a probability of success rather than a single number.
At minimum, 1,000 simulations provide reasonable estimates. For statistically robust results, 5,000-10,000 simulations are recommended. More simulations reduce sampling error and give more stable probability estimates, especially for tail-risk scenarios like prolonged bear markets.
Monte Carlo simulation is more comprehensive than the 4% rule because it accounts for sequence-of-returns risk, variable market conditions, and different asset allocations. The 4% rule assumes a fixed withdrawal rate based on historical worst cases, while Monte Carlo shows the full probability distribution of outcomes across thousands of scenarios.
Most financial planners target 80-95% success probability. Below 80% suggests your plan is underfunded or too aggressive. Above 95% may mean you are being overly conservative and could spend more. The right number depends on your flexibility — can you reduce spending in a downturn?
Monte Carlo naturally models crash scenarios because it randomizes returns across the full historical distribution. Some simulations will include sequences of negative returns early in retirement (the most dangerous scenario). This is called sequence-of-returns risk, and it is the primary advantage of Monte Carlo over simple average-return projections.
Yes. QuantCalc at quantcalc.app offers 50 free Monte Carlo simulations with basic features. For deeper analysis — 10,000 simulations, portfolio optimization, published forecast comparisons, and stress testing — a PRO upgrade is available for a one-time $99 lifetime fee.