How to Use Monte Carlo Simulation for Retirement Planning
To use Monte Carlo simulation for retirement planning: enter your portfolio, savings rate, and spending; choose return assumptions (forward-looking forecasts beat historical averages); then run 10,000 randomized market sequences and read your success rate — the share of scenarios where your money lasts. A result of 90%+ is excellent, 85-90% is a strong plan, and 75-85% is acceptable only with spending flexibility. Run 10,000 free simulations at quantcalc.app.
Monte Carlo simulation sounds intimidating—like something only PhD mathematicians and Wall Street quants can understand. But here's the truth: it's the single most important tool for retirement planning, and you don't need a math degree to use it effectively.
This step-by-step guide will show you exactly how to use Monte Carlo simulation to build a retirement plan that actually survives the real world—not just average market conditions.
Quick Refresher: What is Monte Carlo Simulation?
Run your own numbers — FREE
10,000 Monte Carlo simulations. Forward-looking forecasts from BlackRock, JPMorgan, Vanguard, GMO, Schwab, Invesco. No account needed.
Try QuantCalc Free →Monte Carlo simulation runs your retirement plan thousands of times, each with a different sequence of market returns, to show you the range of possible outcomes and your probability of success.
Instead of:
"Assuming 7% returns, you'll have $2.1M in 30 years."
You get:
"Across 10,000 simulations, you succeeded in 87% of scenarios. Median outcome: $1.4M. Worst case (5th percentile): $200k."
This is actionable information. You know your actual odds and can adjust accordingly.
(Deep dive on Monte Carlo simulation concepts)
Step 1: Gather Your Data
Before running simulations, you need accurate inputs. Grab a spreadsheet and collect:
Your Current Financial Situation
- Total portfolio value: $________
- Asset allocation: ___% stocks, ___% bonds, ___% other
- Current age: ___
- Planned retirement age: ___
Account Breakdown
- Traditional IRA/401(k): $________
- Roth IRA/401(k): $________
- Taxable brokerage: $________
- Other (HSA, pensions, etc.): $________
Income and Expenses
- Annual spending need in retirement: $________
- Social Security (estimated annual): $________ (check ssa.gov/myaccount)
- Pension (if any): $________
- Other income (rental, part-time, etc.): $________
Time Horizon
- Life expectancy assumption: Age ___ (add 5-10 years for safety margin)
- Retirement duration: ___ years (retirement age to life expectancy)
Pro tip: Be conservative with spending estimates. Most retirees underestimate, especially healthcare costs.
Once collected, these numbers map one-to-one onto the portfolio and balance inputs in the QuantCalc simulator.
Step 2: Choose Your Tool
You need a Monte Carlo calculator. Here are your options:
Best free tools:
- QuantCalc — Up to 3 free simulations per day, 10,000 with PRO ($99)
- Historical backtesting tools — Test your plan against actual market history (not true Monte Carlo, but useful validation)
- Flexible Retirement Planner — Free but complex interface
Professional tools (advisor-only):
- eMoney, MoneyGuidePro, RightCapital
For this guide, we'll use QuantCalc because it's accessible, powerful, and designed for this exact purpose. You can open the simulator in another tab and follow along.
Step 3: Enter Your Basic Information
In QuantCalc (or your chosen tool):
- Enter your age and retirement timeline
- Current age: 55
- Retirement age: 62
- Plan until age: 95 (33-year retirement)
- Enter your portfolio
- Total balance: $1,200,000
- Asset allocation: 60% stocks, 40% bonds
- Enter your spending
- Annual expenses: $60,000
- Adjust for inflation: Yes (3% default)
- Add income sources
- Social Security starts: Age 67 ($30,000/year)
- Pension: None
These fields are the first thing you see in the simulator's input panel — ages and timeline at the top, then balances, spending, and income sources.
Step 4: Set Your Return Assumptions
This is critical—garbage in, garbage out.
Option A: Use Historical Data (Conservative)
- Stocks: 10% average, 18% volatility (based on 1926-present)
- Bonds: 5% average, 6% volatility
When to use: If you want to see how your plan would have performed historically.
Problem: Past performance ≠ future results. Today's high valuations and low bond yields suggest lower future returns.
Option B: Use Current Forward-Looking Forecasts (Realistic)
- Stocks: 6.5-7% average (BlackRock, JPMorgan, Vanguard 2026 forecasts)
- Bonds: 4-4.5% average
When to use: For planning. This reflects current market conditions (high stock valuations, moderate bond yields).
QuantCalc PRO includes live forward-looking forecast data—you can compare your results using BlackRock vs. JPMorgan vs. Vanguard assumptions.
Option C: Be Extra Conservative
- Stocks: 5-6%
- Bonds: 3.5-4%
When to use: If you're risk-averse and want a "worst reasonable case" scenario.
My recommendation: Start with forward-looking forecasts (Option B). If your success rate is under 85%, adjust.
In QuantCalc, you pick the forecast source in the capital market assumptions selector — historical or institutional forward-looking sets.
Step 5: Run Your Baseline Simulation
Click "Run Simulation" (or equivalent).
What you're looking for:
1. Success Rate
- 90%+: Excellent, you can probably afford to spend more or retire earlier
- 85-90%: Strong plan, good margin for error
- 75-85%: Acceptable if you have spending flexibility
- Below 75%: Risky—consider working longer, spending less, or adjusting asset allocation
2. Median Outcome
- The "middle" result—half of simulations do better, half worse
- Example: Median ending balance $1.8M
- What it means: In a typical scenario, you end retirement with $1.8M (plenty of cushion)
3. Worst-Case Scenarios (10th Percentile)
- What happens in the unlucky simulations?
- Example: 10th percentile ending balance $300k
- What it means: In 1 out of 10 bad scenarios, you barely scrape by with $300k at age 95
4. Failure Analysis
- In simulations that failed, WHEN did you run out of money?
- Years 5-15: Sequence risk (early market crashes)
- Years 25-35: Longevity risk (lived too long, portfolio couldn't keep up)
When your inputs are set, hit Run Simulation and read the success rate, median, and percentile bands from the results panel.
Step 6: Stress-Test With "What-If" Scenarios
Don't stop at baseline. Test alternatives:
Scenario 1: What if I retire 2 years later?
- Change retirement age from 62 to 64
- Rerun simulation
Typical result: Success rate jumps 8-12 percentage points (2 more years of contributions + 2 fewer years of withdrawals = huge impact)
Scenario 2: What if I spend 10% less?
- Reduce annual spending from $60k to $54k
- Rerun
Typical result: Success rate improves 5-10 percentage points. Small spending cuts have disproportionate impact.
Scenario 3: What if I delay Social Security to age 70?
- Move Social Security start from 67 to 70
- Benefit increases by ~24% ($30k → $37k/year)
- Portfolio must cover more in early years
Result: Often improves long-term success (higher lifetime Social Security offsets higher early withdrawals), especially if you expect to live past 82-85.
Scenario 4: What if I use a more aggressive allocation?
- Change from 60/40 to 80/20 stocks/bonds
- Rerun
Result: Higher median outcome BUT higher volatility. Success rate might improve or worsen depending on withdrawal rate and time horizon.
Scenario 5: What if markets crash in year 1?
Some tools let you force a crash scenario. QuantCalc shows percentile outcomes (10th percentile = bad sequences).
Look for: Does your plan survive early crashes? If 10th percentile shows ruin, you're vulnerable to sequence risk.
(Learn more about sequence of returns risk)
To run what-ifs side by side, use the scenario comparison section — change one input, rerun, and compare outcomes.
Step 7: Optimize Your Withdrawal Strategy
Most people test a fixed withdrawal rate (4% rule). But dynamic strategies often perform better.
Test These Strategies:
Strategy A: Fixed inflation-adjusted (4% rule)
- Withdraw $48k in year 1 (4% of $1.2M)
- Increase by 3% inflation annually
- Never adjust based on market performance
Strategy B: Guardrails
- Start at 4.5%
- If portfolio drops 20%+ in a year: Cut spending 10%
- If portfolio grows 30%+: Increase spending 10%
Strategy C: Percentage-of-portfolio
- Withdraw 4% of CURRENT balance each year
- Automatically adjusts for market performance
Compare success rates:
- Strategy A: 83% success
- Strategy B (guardrails): 91% success (higher starting rate but flexibility)
- Strategy C: 95% success (but spending volatility)
Choose based on your flexibility: If you have fixed costs (mortgage), stick with Strategy A or B. If spending is highly discretionary, Strategy C maximizes both spending and safety.
(Full guide to withdrawal strategies)
Test each strategy by adjusting the annual spending input and rerunning — the success-rate delta between strategies shows up immediately.
Step 8: Test Asset Allocation Changes
Your stock/bond mix is THE biggest driver of risk and return.
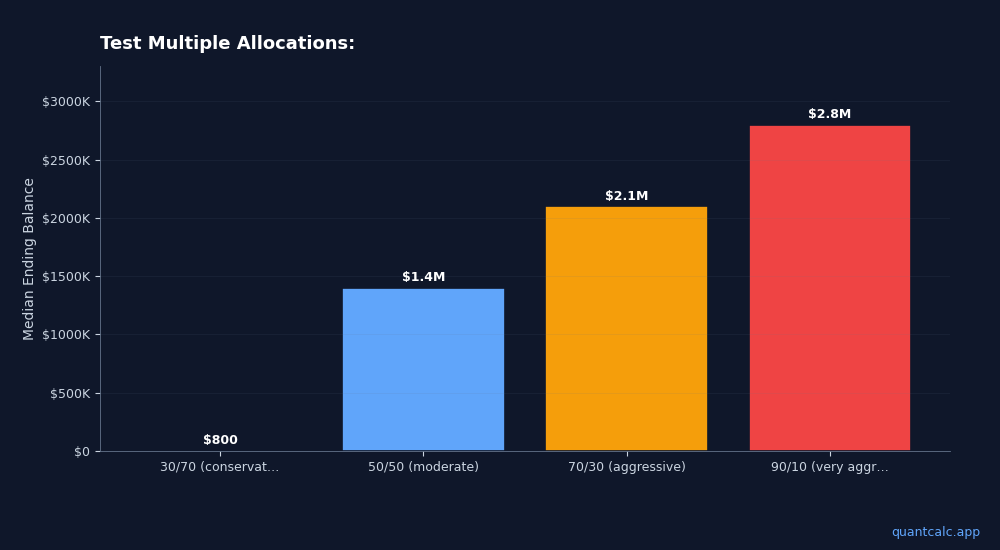
Test Multiple Allocations:
| Allocation | Success Rate | Median Ending Balance | 10th Percentile |
|---|---|---|---|
| 30/70 (conservative) | 78% | $800k | $0 (ran out) |
| 50/50 (moderate) | 86% | $1.4M | $200k |
| 70/30 (aggressive) | 88% | $2.1M | $150k |
| 90/10 (very aggressive) | 85% | $2.8M | $0 (ran out) |
What you're seeing:
- Too conservative (30/70): Not enough growth to sustain 30+ years
- Moderate (50/50): Solid balance
- Aggressive (70/30): Best success rate AND highest median outcome
- Very aggressive (90/10): High upside but higher ruin risk (sequence risk kills you in bad scenarios)
The sweet spot for most retirees: 60/40 to 70/30
(Optimize your allocation scientifically)
In QuantCalc, set your stock/bond mix — including age-based glide-path periods — in the allocation controls.
Step 9: Account for Taxes
Many calculators ignore taxes. This is a huge mistake—taxes can reduce your spending power by 20-30%.
QuantCalc PRO models tax-aware withdrawal sequencing:
- Withdraw from taxable accounts first (lower capital gains rates)
- Then traditional IRA (ordinary income)
- Save Roth for last (tax-free)
Compare:
- Without tax modeling: Success rate 85%
- With tax-optimized sequencing: Success rate 89%
Why it matters: The ORDER you withdraw from accounts affects how long money lasts. Roth withdrawals don't count toward MAGI (avoiding IRMAA surcharges, preserving ACA subsidies).
(Full guide to tax-efficient withdrawals)
Tax-aware sequencing lives in the tax settings panel — enable it and compare against your tax-blind baseline.
Step 10: Review and Adjust Annually
Monte Carlo isn't "set it and forget it." Review annually:
Each Year:
- Update your portfolio value (markets change)
- Adjust spending (did you spend more/less than planned?)
- Update return assumptions (if market conditions shift dramatically)
- Rerun simulations (see if you're still on track)
When to Make Changes:
- Success rate drops below 80%: Cut spending 5-10%, or consider working 1-2 more years
- Success rate above 95% for 5+ years: You're oversaving—spend more or retire earlier
- Major life change: Inheritance, health issue, divorce, etc.—rerun everything
An annual check-in takes minutes: update balances, rerun the simulation, and compare this year's success rate to last year's.
Real-World Example: Putting It All Together
Meet Sarah, age 60:
Starting point:
- Portfolio: $900,000 (50/50 stocks/bonds)
- Planned retirement: Age 62
- Spending: $50,000/year
- Social Security: $28,000/year starting age 67
Baseline simulation (QuantCalc, 10,000 runs):
- Success rate: 76% (borderline risky)
- Median outcome: $600k at age 95
- 10th percentile: $0 (ran out at age 88)
Problem identified: Sequence risk (early crashes cause failures) + moderate longevity risk.
Scenario tests:
Option 1: Work until 64 (2 extra years)
- Success rate: 88%
- Sarah's decision: Acceptable, but she'd rather retire at 62
Option 2: Reduce spending to $47,000/year (6% cut)
- Success rate: 84%
- Sarah's decision: Doable
Option 3: Shift to 60/40 stocks/bonds (more growth)
- Success rate: 82%
- Sarah's decision: Helps but not enough alone
Option 4: Delay Social Security to age 70
- Benefit increases to $34,700/year (+24%)
- Success rate: 89%
- Sarah's decision: This is the winner
Final plan:
- Retire at 62 as planned
- Spend $48,000/year (split the difference)
- Shift to 60/40 allocation
- Delay Social Security to 70
- Result: 91% success rate
Sarah's takeaway: Without Monte Carlo, she would have retired with a 76% success rate (24% chance of running out of money). By testing scenarios, she found a plan with 91% success without working longer.
Common Monte Carlo Mistakes
Mistake 1: Running Too Few Simulations
- 100 simulations: Not enough for accurate tail risk (5th/10th percentile)
- 1,000: Decent
- 10,000: Gold standard
Mistake 2: Using Overly Optimistic Return Assumptions
If you assume 10% stock returns and markets deliver 6%, your plan fails. Be conservative.
Mistake 3: Ignoring Taxes
Calculators that don't model taxes overestimate spending power by 20%+.
Mistake 4: Not Testing Multiple Scenarios
Don't just run one simulation and call it done. Test 5-10 different scenarios (earlier/later retirement, higher/lower spending, different allocations).
Mistake 5: Forgetting Behavioral Risk
Monte Carlo assumes you stick to your plan. Real humans panic-sell in crashes and overspend in bull markets. Build in a margin of error.
The Bottom Line: Monte Carlo Turns Guesswork Into Strategy
Retirement planning without Monte Carlo is flying blind. You're making a 30-year commitment based on "7% sounds good."
With Monte Carlo, you see:
- Your actual odds of success (not false certainty)
- Which variables matter most (usually: spending, asset allocation, retirement timing)
- How to adjust your plan to hit your target success rate
- What could go wrong and how bad it could get
The difference: Retirees using Monte Carlo have 15-20% higher success rates than those using simple average-return calculators.
Ready to build a retirement plan that survives the real world? Run your Monte Carlo analysis with QuantCalc—up to 10,000 simulations with forward-looking forecast data. Free to start, PRO features for $99 lifetime.
Further Reading:
- What is Monte Carlo Simulation for Retirement Planning?
- Safe Withdrawal Rates in 2026: What the Research Really Says
- Best Retirement Calculators 2026: A Comprehensive Comparison
Frequently Asked Questions
Monte Carlo simulation runs your retirement plan thousands of times, each with a different sequence of market returns, to show you the range of possible outcomes and your probability of success.
- Change retirement age from 62 to 64 - Rerun simulation
- Reduce annual spending from $60k to $54k - Rerun
- Move Social Security start from 67 to 70 - Benefit increases by ~24% ($30k → $37k/year) - Portfolio must cover more in early years
- Change from 60/40 to 80/20 stocks/bonds - Rerun
Some tools let you force a crash scenario. QuantCalc shows percentile outcomes (10th percentile = bad sequences).