What Does Your Monte Carlo Retirement Success Rate Actually Mean?
What's a good Monte Carlo success rate? For most planners, 80-90% is the sweet spot: the plan survives most market environments, and the failures cluster in extreme scenarios where you'd adjust behavior anyway. Below 70% signals structural problems (spending, timing, or savings). Above 95% usually means you're underspending and will die with more money than you need. A success rate of 100% is not the goal — flexibility is. Run your own success rate at quantcalc.app.
You ran your numbers through a Monte Carlo retirement calculator. It says 85% probability of success. Now what?
Most people see that number and think: "There's an 85% chance I'll be fine." That's not wrong, exactly. But it's an incomplete understanding that can lead to bad decisions — either panicking over a number that's perfectly healthy, or coasting on one that should concern you.
Here's what that percentage actually tells you, and how to use it without losing sleep.
How Monte Carlo Simulation Works
Run your own numbers — FREE
10,000 Monte Carlo simulations. Forward-looking forecasts from BlackRock, JPMorgan, Vanguard, GMO, Schwab, Invesco. No account needed.
Try QuantCalc Free →A Monte Carlo retirement simulation doesn't predict your future. It generates thousands of possible futures and counts how many of them work out.
Each simulation run takes your inputs — savings, contributions, spending, asset allocation, retirement age — and applies a random sequence of market returns drawn from historical or projected distributions. One run might start with three great years followed by a crash. Another might front-load a recession. A third might give you steady, mediocre returns for decades.
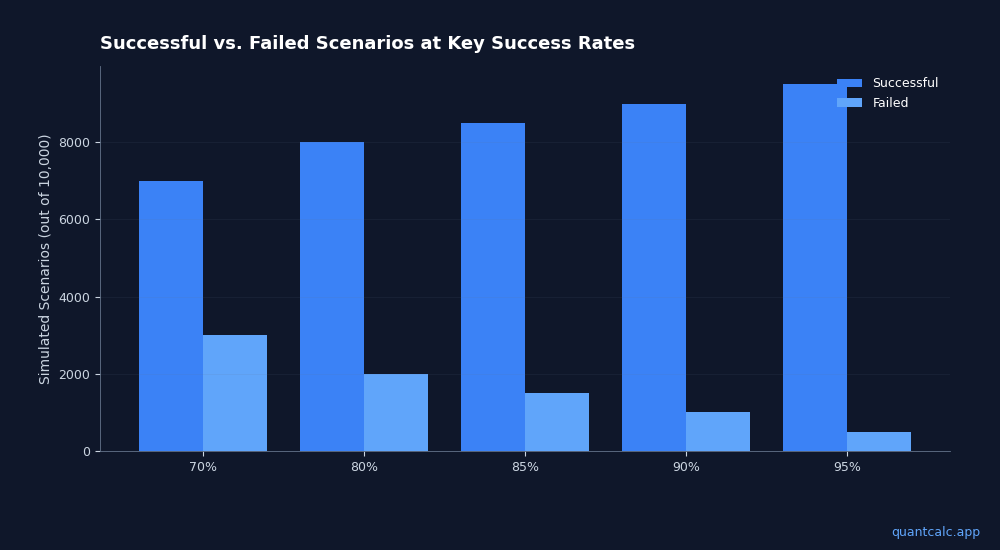
After running 1,000 or 10,000 of these scenarios, the calculator counts: in how many did your money last through your full retirement? That fraction is your success rate.
An 85% success rate means that in 8,500 out of 10,000 randomly generated market histories, your portfolio survived. In the other 1,500, you ran out of money before the end.
What 85% Does NOT Mean
It does not mean there's an 85% chance the market will perform well. The market's actual performance is one specific path. Monte Carlo doesn't predict which path you'll get — it maps the distribution of possibilities.
It does not mean your plan is set-and-forget. An 85% success rate today assumes you'll never adjust your spending, never pick up part-time work, never change your allocation. Real retirees adapt. Your actual probability of running out of money is likely much lower than the failure rate suggests, because you'll make changes along the way.
It does not mean 100% is the right target. A 100% success rate usually means you're dramatically underspending. You've built a plan so conservative that you'd survive the Great Depression, the 1970s stagflation, and the 2008 crisis back-to-back — and still die with millions in the bank. That's not optimal retirement planning. That's hoarding.
What Range Is Actually Healthy?
There's no universal answer, but here's how experienced financial planners tend to think about it:
- Below 70%: Your plan has structural problems. You're either spending too much, retiring too early, or not saving enough. Major adjustments needed.
- 70-80%: Workable, but tight. You'll need to be flexible — willing to cut spending or work part-time if markets underperform in your early retirement years. This is where sequence-of-returns risk really matters.
- 80-90%: The sweet spot for most planners. Your plan survives most market environments, and the failure scenarios tend to be extreme events where you'd likely adjust behavior anyway.
- 90-95%: Conservative and comfortable. You have meaningful margin. The trade-off is you're probably leaving money on the table — spending less than you could.
- Above 95%: Very conservative. You're almost certainly going to die richer than you need to be. Consider whether that money could improve your quality of life now.
The Failure Scenarios Matter More Than the Number
Instead of fixating on whether you're at 83% or 87%, look at what the failure scenarios look like.
In most Monte Carlo simulations, the failures cluster around one specific pattern: a major market downturn in the first 3-5 years of retirement. This is sequence-of-returns risk — the same average returns can produce wildly different outcomes depending on when the bad years hit.
If the failures in your simulation all involve a 2008-style crash in year one of retirement, that tells you something actionable: build a cash buffer for the first few years, or plan a flexible spending rule that reduces withdrawals after a bad market year. You don't need to push your success rate to 98% — you need a strategy for the specific scenario that causes failure.
Why Your Assumptions Matter More Than the Math
The success rate is only as good as the inputs behind it. Two assumptions dominate the output:
1. Expected returns. Are you using historical averages (7% real for U.S. equities)? Or forward-looking estimates? Major institutions — BlackRock, Vanguard, JPMorgan, GMO — all publish capital market assumptions, and they often differ significantly from historical averages. A Monte Carlo simulation using Vanguard's 10-year equity forecast will produce very different results than one using the last century's average.
2. Spending pattern. Most calculators assume constant inflation-adjusted spending. But real retirement spending isn't flat. It often follows a "smile" pattern: higher in early active retirement, lower in the quiet middle years, then higher again with healthcare costs. If your calculator assumes flat spending, it may overestimate your failure probability.
At QuantCalc, you can compare your success rate under CME futures-implied rates, BlackRock's capital market assumptions, JPMorgan's long-term forecasts, Vanguard's projections, and GMO's 7-year estimates — side by side. The difference between the most optimistic and most pessimistic forward-looking forecast can swing your success rate by 15-20 percentage points. That spread tells you more about uncertainty than any single number.
What To Do With Your Number
- Run it under multiple forecast assumptions. If your plan shows 90% under optimistic forecasts but 65% under pessimistic ones, you have a plan that depends on favorable markets. That's worth knowing.
- Look at the failure distribution. When does your money run out in the bad scenarios? Year 25 of a 30-year retirement is different from year 10. The former is manageable. The latter is a crisis.
- Build in flexibility. The real-world safety net isn't a higher success rate — it's your willingness to adapt. A plan with 82% success rate plus a flexible spending rule beats a plan with 95% success rate where you stubbornly spend the same amount regardless of market conditions.
- Rerun annually. Your success rate will change every year as markets move, your savings grow, and your timeline shortens. A single run gives you a snapshot. Annual check-ins give you a trajectory.
- Don't compare across calculators. Different tools use different return distributions, different fee assumptions, different inflation models. An 85% in one calculator is not the same as an 85% in another. Pick one tool, learn its assumptions, and track your progress consistently.
The Bottom Line
Your Monte Carlo success rate is a stress test, not a prophecy. It tells you how robust your plan is across a wide range of possible futures. An 85% success rate doesn't mean you'll probably be fine — it means your plan survives the vast majority of historical market environments, including some very bad ones.
The number is useful. The obsession with getting it to 95%+ is usually counterproductive. Focus on understanding your failure scenarios, building in flexibility, and picking assumptions that reflect current market conditions — not just historical averages.
Run your numbers at quantcalc.app. The free tier gives you 100 simulations to start exploring. If you want to see how your plan holds up under different forward-looking forecasts with 10,000 simulations, that's what PRO is for.
Further Reading
Frequently Asked Questions
What does a Monte Carlo success rate mean for retirement?
The success rate is the percentage of simulated scenarios where your portfolio lasted through your entire retirement without running out of money. A 90% success rate means in 9,000 of 10,000 simulations, your plan worked. Financial planners typically target 80-95% depending on spending flexibility. Below 80% signals a plan that needs adjustment — either lower spending, later retirement, or higher savings.
What Monte Carlo success rate do I need to retire safely?
Most financial planners recommend 85-95% for fixed-spending plans. If you have flexible spending (willing to cut 10-20% in bad years), 80% may be acceptable. Above 95% often indicates over-saving — you could spend more or retire earlier. The key insight is that success rate varies based on the return assumptions used: historical averages typically show higher rates than forward-looking published forecasts.
Frequently Asked Questions
The success rate is the percentage of simulated scenarios where your portfolio lasted through your entire retirement without running out of money. A 90% success rate means in 9,000 of 10,000 simulations, your plan worked. Financial planners typically target 80-95% depending on spending flexibility. Below 80% signals a plan that needs adjustment — either lower spending, later retirement, or higher savings.
Most financial planners recommend 85-95% for fixed-spending plans. If you have flexible spending (willing to cut 10-20% in bad years), 80% may be acceptable. Above 95% often indicates over-saving — you could spend more or retire earlier. The key insight is that success rate varies based on the return assumptions used: historical averages typically show higher rates than forward-looking published forecasts.