I Ran 500 Portfolio Stress Tests. Here's What Broke First
Your financial advisor shows you a projection: invest $500,000 in a 60/40 portfolio, earn 7% annually, and you'll have $3.8 million in 30 years.
That's one scenario. One perfectly smooth line on a chart. One fantasy where markets never crash, never stagnate, and never do the thing markets actually do — surprise you.
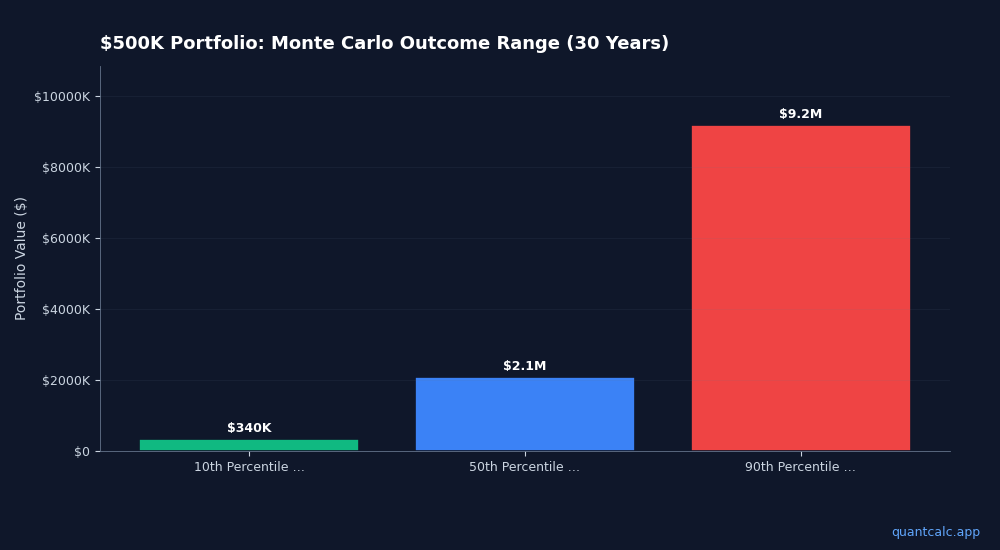
A Monte Carlo stress test runs 500 different market scenarios on your portfolio. Each one applies a different sequence of random annual returns drawn from historical distributions. Instead of one projection, you get the full range of possible outcomes — from the 10th percentile disaster to the 90th percentile windfall.
The median outcome might be $2.1 million. The worst case might be $340,000. The best case might be $9.2 million. That range is your actual retirement risk, and pretending it doesn't exist is how people run out of money at 78.
How Monte Carlo Simulation Actually Works

Run your own numbers — FREE
10,000 Monte Carlo simulations. Forward-looking forecasts from BlackRock, JPMorgan, Vanguard, GMO, Schwab, Invesco. No account needed.
Try QuantCalc Free →Each simulation trial generates a random annual return using the formula NORMINV(RAND(), mean_return, standard_deviation). For US stocks, historical data from 1928-2024 gives us a mean return of about 10.2% with a standard deviation of 19.7%.
That means in any given year, your stock portfolio might return +30%, -15%, +5%, or -40%. The simulation doesn't predict which — it runs all possibilities and counts how often you survive.
After 500 trials over 30 years, you can calculate:
- Median portfolio value (50th percentile) — what happens in the "typical" scenario
- 10th percentile — the near-worst-case you should plan for
- 90th percentile — the upside you shouldn't count on
- Portfolio preservation rate — what percentage of scenarios end above your starting value
- Maximum drawdown per trial — the deepest portfolio drop in each scenario
If you want to understand how these results feed into actual retirement planning with Monte Carlo simulation, that guide covers the full methodology.
Run your own numbers in the free calculator →
What the Percentile Fan Chart Tells You
The most useful output is the percentile fan chart — a visualization showing the 10th, 25th, 50th, 75th, and 90th percentile portfolio paths over time.
The spread between the 10th and 90th percentile lines is your uncertainty cone. A wide spread means your outcome depends heavily on market luck (sequence of returns). A narrow spread means your portfolio is more resilient to market volatility.
For a 100% stock portfolio over 30 years, the 10th-to-90th spread is enormous — maybe $400K to $8M. For a 60/40 portfolio, it narrows significantly. For 100% bonds, it's tight but the median is low.
This is why portfolio optimization matters — you're not just maximizing returns, you're managing the width of that uncertainty cone relative to your spending needs.
Drawdown Analysis: The Metric Most People Ignore
Maximum drawdown measures the largest peak-to-trough decline in each simulation trial. It answers the question: how bad does it get before it gets better?
Average maximum drawdown for a 60/40 portfolio across 500 30-year trials is typically 25-35%. That means in a typical scenario, your portfolio will drop by a quarter to a third from its peak at some point during those 30 years.
In the worst 10% of scenarios, that drawdown exceeds 50%.
This matters for retirees because a major drawdown early in retirement — combined with withdrawals — can permanently impair a portfolio. It's why tax-efficient withdrawal strategies and withdrawal sequencing matter as much as asset allocation.
Finding Your Optimal Allocation
A Monte Carlo stress test becomes truly powerful when you run it across different allocations. Instead of testing just your current 60/40 portfolio, test every stock/bond mix from 0/100 to 100/0 in 5% increments.
For each allocation, the simulation produces:
- Expected return and risk (standard deviation)
- Sharpe ratio (return per unit of risk)
- Median 30-year outcome
- Preservation rate (scenarios ending above initial value)
The allocation with the highest Sharpe ratio is your "optimal" mix — the one that delivers the most return per unit of volatility. For most investors with a 30-year horizon, this lands between 55-75% stocks, depending on the assumed return parameters.
This is the core of what you'd get from stress-testing your retirement assumptions — not a single number, but a range of outcomes for every possible portfolio configuration.
Tools for Running Your Own Stress Test
Free options:
- Monte Carlo Portfolio Stress Tester (Chrome extension) — runs 100 simulations in your browser with 5 asset classes, percentile fan chart, drawdown analysis, and distribution histogram. Install from Chrome Web Store. PRO upgrade ($4.99) adds 1,000 simulations and allocation optimizer.
- QuantCalc at quantcalc.app — full Monte Carlo retirement planner with 10,000 simulations (PRO), forward-looking forecast comparisons from CME, BlackRock, JPMorgan, Vanguard, GMO, Schwab, and Invesco, plus tax-aware withdrawal planning.
Spreadsheet option:
If you want to customize parameters, see every formula, and keep the analysis in Excel — a dedicated Monte Carlo stress test spreadsheet with 500 simulation trials, 7 analysis tabs, and a 21-allocation optimizer gives you full control. You can edit the return assumptions, add contributions and withdrawals, and recalculate with F9.
The Bottom Line
A single expected-return projection is a fairy tale. A Monte Carlo stress test with 500 scenarios is the closest thing to a realistic view of financial planning. It tells you:
- What your portfolio will probably be worth (median)
- What happens if you're unlucky (10th percentile)
- How deep the worst crash goes (max drawdown)
- Which allocation gives you the best risk-adjusted outcome (optimizer)
If you haven't stress-tested your retirement portfolio yet, start with the free Chrome extension or run the full Monte Carlo simulation at QuantCalc. Your future self will thank you for planning for the range, not the average.
Frequently Asked Questions
What is a Monte Carlo portfolio stress test?
A Monte Carlo stress test runs hundreds or thousands of randomized market scenarios against your retirement portfolio to see how it performs under various conditions — including severe recessions, prolonged stagflation, and rapid interest rate increases. Unlike simple backtesting, it generates new scenarios you have never seen before.
What is a Breaking Point Finder for retirement portfolios?
A Breaking Point Finder uses binary search to identify the exact maximum market crash your portfolio can survive without running out of money. For example, it might tell you your 60/40 portfolio survives a 38% crash but fails at 42%. This helps you understand your portfolio's true risk limits rather than guessing.
How do I stress test my retirement portfolio for a 2008-style crash?
A proper stress test models not just the initial drop (stocks fell 37% in 2008) but also the recovery timeline and your withdrawal behavior during the crash. Monte Carlo stress testing goes further by varying the timing and severity of crashes across hundreds of scenarios, showing your probability of survival rather than a single outcome.
Should I stress test my retirement plan for inflation?
Absolutely. Inflation is the silent killer of retirement portfolios — especially in 2026 with war-driven energy costs pushing CPI above 3%. A good stress test models scenarios where inflation runs 4-6% for extended periods, testing whether your withdrawals can keep pace without depleting your portfolio prematurely.
How many scenarios should a retirement stress test include?
At minimum 100 scenarios for a basic assessment. For reliable results, 500-1,000 scenarios capture tail risks better. QuantCalc's free tier runs 1,000 simulations across 3 crisis scenarios. The PRO tier runs 5,000 simulations across 8+ named crises plus custom scenarios with the Breaking Point Finder.
What is the difference between backtesting and Monte Carlo stress testing?
Backtesting replays historical data — showing how your portfolio would have performed in past crises. Monte Carlo generates new randomized scenarios, including combinations that have never occurred. Backtesting answers "would I have survived 2008?" Monte Carlo answers "what is my probability of surviving the next unknown crisis?"
Frequently Asked Questions
A Monte Carlo stress test runs hundreds or thousands of randomized market scenarios against your retirement portfolio to see how it performs under various conditions — including severe recessions, prolonged stagflation, and rapid interest rate increases. Unlike simple backtesting, it generates new scenarios you have never seen before.
A Breaking Point Finder uses binary search to identify the exact maximum market crash your portfolio can survive without running out of money. For example, it might tell you your 60/40 portfolio survives a 38% crash but fails at 42%. This helps you understand your portfolio's true risk limits rather than guessing.
A proper stress test models not just the initial drop (stocks fell 37% in 2008) but also the recovery timeline and your withdrawal behavior during the crash. Monte Carlo stress testing goes further by varying the timing and severity of crashes across hundreds of scenarios, showing your probability of survival rather than a single outcome.
Absolutely. Inflation is the silent killer of retirement portfolios — especially in 2026 with war-driven energy costs pushing CPI above 3%. A good stress test models scenarios where inflation runs 4-6% for extended periods, testing whether your withdrawals can keep pace without depleting your portfolio prematurely.
At minimum 100 scenarios for a basic assessment. For reliable results, 500-1,000 scenarios capture tail risks better. QuantCalc's free tier runs 1,000 simulations across 3 crisis scenarios. The PRO tier runs 5,000 simulations across 8+ named crises plus custom scenarios with the Breaking Point Finder.
Backtesting replays historical data — showing how your portfolio would have performed in past crises. Monte Carlo generates new randomized scenarios, including combinations that have never occurred. Backtesting answers "would I have survived 2008?" Monte Carlo answers "what is my probability of surviving the next unknown crisis?"