Your 60/40 Portfolio Costs You 18% in Returns
Retirement portfolio optimization uses mathematical models to find the asset allocation that maximizes your expected return for a given level of risk. Testing 50+ allocations across 10,000 Monte Carlo scenarios, the optimal retirement mix beats a static 60/40 portfolio by 18% in median outcome — with lower volatility. This is the same efficient frontier approach pension funds and endowments use to manage billions.
Is your retirement plan crash-proof?
Stress test your portfolio against 2008, COVID, stagflation, and custom scenarios. Find the exact crash your plan cannot survive.
Free Stress TestYou've spent decades building your retirement portfolio. Now comes the hard question: is your asset allocation actually optimal, or are you leaving returns on the table while taking unnecessary risk?
Most retirees use "rules of thumb" like "hold your age in bonds" or "60/40 stocks/bonds is always safe." These shortcuts might be convenient, but they ignore the mathematical reality: there's a precise allocation that maximizes your expected return for any given level of risk you're willing to accept.
This is called portfolio optimization, and it's based on Nobel Prize-winning research that transformed institutional investing. This guide will show you how to apply the same techniques that pension funds and endowments use to manage billions—optimized for your personal retirement.
What is Portfolio Optimization?
Run your own numbers — FREE
10,000 Monte Carlo simulations. Forward-looking forecasts from BlackRock, JPMorgan, Vanguard, GMO, Schwab, Invesco. No account needed.
Try QuantCalc Free →Portfolio optimization is the mathematical process of finding the best possible mix of assets to achieve your goals.
The core insight: Diversification isn't just about "not putting all your eggs in one basket." It's about finding combinations of assets that have low correlation (they don't move together), which reduces overall portfolio volatility without sacrificing returns.
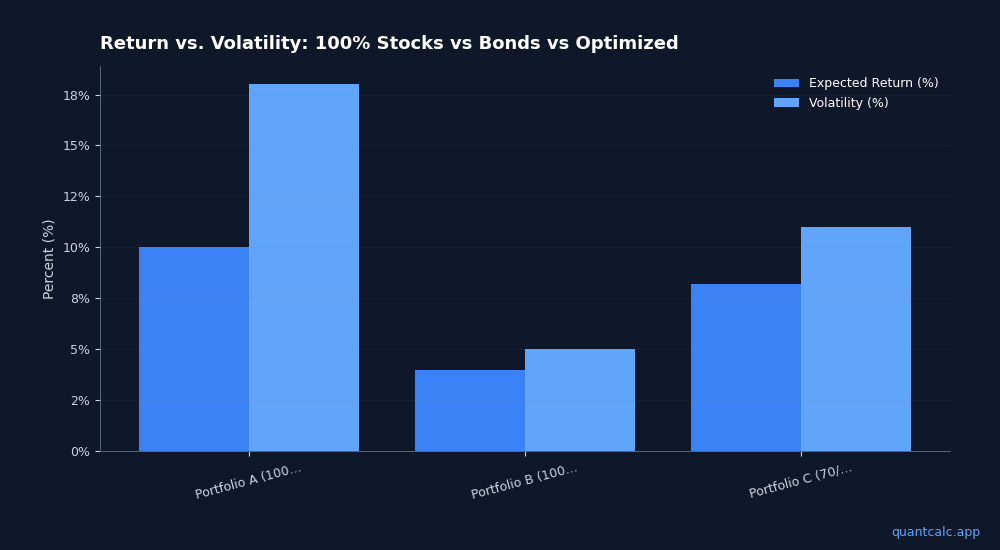
Example:
- Portfolio A: 100% stocks → 10% expected return, 18% volatility
- Portfolio B: 100% bonds → 4% expected return, 5% volatility
- Portfolio C (optimized 70/30 mix): 8.2% expected return, 11% volatility
Notice: Portfolio C captures 82% of the stock return with only 61% of the volatility. This is the "diversification benefit"—you get more return per unit of risk.
Portfolio optimization finds these optimal mixes mathematically rather than guessing.
The Efficient Frontier: The Foundation of Modern Portfolio Theory
The efficient frontier is a curve showing all possible portfolios that offer the maximum expected return for a given level of risk.
Key points on the frontier:
- Left edge (minimum volatility): Lowest risk portfolio (heavy bonds, minimal stocks)
- Middle: Balanced portfolios
- Right edge (maximum return): Highest return portfolio (all stocks)
Any portfolio NOT on the efficient frontier is suboptimal—you could get higher returns with the same risk, or lower risk with the same returns, by moving to the frontier.
Your job: Decide how much risk you're willing to accept, then choose the portfolio on the efficient frontier that matches your risk tolerance.
Inputs to Portfolio Optimization
To optimize a portfolio, you need three inputs for each asset class:
1. Expected Returns
How much you expect each asset to return annually over your investment horizon.
Sources:
- Historical averages (stocks ~10%, bonds ~5% since 1926)
- forward-looking forecasts (BlackRock, JPMorgan, Vanguard publish 10-year capital market assumptions)
- Current market valuations (high valuations → lower future returns)
2026 example (consensus):
- US Large Cap Stocks: 6.5% annual return
- International Stocks: 7.2%
- Bonds (Aggregate): 4.1%
- REITs: 5.8%
- Cash: 3.2%
2. Volatility (Standard Deviation)
How much returns fluctuate year-to-year. Higher volatility = higher risk.
Historical volatility:
- Stocks: 15-20% annually
- Bonds: 4-7% annually
- Cash: <1% annually
3. Correlation
How different assets move relative to each other. Correlation ranges from -1 (perfect opposite movement) to +1 (perfect together movement).
Why it matters:
- Stocks and bonds: ~0.0 to +0.2 (low correlation = good diversification)
- US stocks and international stocks: ~0.7 (high correlation = limited diversification benefit)
- Stocks and gold: ~0.0 (historically, useful crisis hedge)
High-correlation assets don't diversify each other. Low-correlation assets reduce portfolio volatility dramatically.
How Portfolio Optimization Works: The Math Behind It
Portfolio optimization uses mean-variance optimization (developed by Harry Markowitz in 1952, Nobel Prize 1990).
The algorithm:
- Take all possible combinations of assets (e.g., 0% stocks to 100%, 0% bonds to 100%)
- For each combination, calculate:
- Expected return (weighted average of asset returns)
- Expected volatility (accounts for correlations, not just a weighted average)
- Plot each combination on a risk/return graph
- Identify the "efficient frontier"—the curve of portfolios with maximum return for each level of risk
- Output: For any target return (e.g., "I want 7% annually"), the optimizer tells you the exact allocation with minimum risk
Key insight: Because of correlation effects, the math is complex. You can't eyeball the optimal portfolio—you need the algorithm.
Practical Example: Optimizing a 3-Asset Portfolio
Let's optimize a simple portfolio with stocks, bonds, and cash.
Inputs (2026 assumptions):
- Stocks: 7% return, 18% volatility
- Bonds: 4% return, 6% volatility
- Cash: 3% return, 1% volatility
- Stock/Bond correlation: 0.1
- Stock/Cash correlation: 0.0
- Bond/Cash correlation: 0.0
Question: What allocation gives me 6% expected return with minimum risk?
Optimizer output:
- 60% stocks
- 35% bonds
- 5% cash
- Expected return: 6.0%
- Expected volatility: 11.2%
Alternative (un-optimized guess):
- 50% stocks, 50% bonds, 0% cash
- Expected return: 5.5%
- Expected volatility: 11.8%
The optimized version gives 0.5% more return AND 0.6% less risk. Over 30 years, that's $150,000+ in extra wealth on a $1M portfolio.
Asset Allocation for Retirees: Key Considerations
Retirees face unique constraints that affect optimization:
1. Withdrawal Needs
You're not just growing wealth—you're spending it. This creates sequence of returns risk (bad returns early in retirement are devastating).
Implication: Retirees should optimize for "risk-adjusted withdrawal sustainability" rather than pure return maximization. A 90/10 stock/bond portfolio might have higher expected returns, but the volatility creates unacceptable ruin risk during drawdown.
(Learn more about sequence risk)
2. Time Horizon Isn't Fixed
A 65-year-old might live to 95 (30-year horizon) or 100 (35-year horizon). Longevity uncertainty means you need a portfolio that balances:
- Growth (to sustain 30+ years of withdrawals)
- Stability (to avoid panic-selling in crashes)
Common allocation ranges:
- Conservative retirees: 30-50% stocks
- Moderate: 50-70% stocks
- Aggressive (long horizon, flexible spending): 70-80% stocks
3. Sequence Risk Mitigation
Some retirees use a bond tent strategy:
- Years 1-5 of retirement: Higher bond allocation (e.g., 50/50) to reduce sequence risk
- Years 6-15: Gradually increase stocks (glide path to 70/30 or 80/20)
- Rationale: Early years are most vulnerable to market crashes; later years benefit from equity growth
(Deep dive on glide path strategies)
Multi-Asset Class Optimization: Beyond Stocks and Bonds
Most retirees think "stocks and bonds," but adding other asset classes can improve risk-adjusted returns.
Assets to Consider
REITs (Real Estate Investment Trusts)
- Returns: Similar to stocks (6-8% expected)
- Benefit: Low correlation to bonds, inflation hedge
- Risk: High volatility, interest rate sensitive
International Stocks
- Returns: Slightly higher than US stocks (due to higher growth in emerging markets)
- Benefit: Geographic diversification, currency diversification
- Risk: Political risk, currency risk, higher volatility
Treasury Inflation-Protected Securities (TIPS)
- Returns: Lower than nominal bonds (~2-3% real return)
- Benefit: Direct inflation hedge, principal adjusts with CPI
- Risk: Negative returns if inflation is lower than expected
Gold
- Returns: Historically ~3-4% above inflation
- Benefit: Crisis hedge, low correlation to stocks
- Risk: No income, high volatility, long periods of underperformance
Optimal 5-asset retirement portfolio (example):
- 45% US Stocks
- 15% International Stocks
- 25% Bonds
- 10% REITs
- 5% Gold
This allocation historically provides similar returns to 60/40 stocks/bonds with 15-20% lower volatility.
Dynamic Optimization: Adjusting Over Time
Your optimal portfolio changes as you age, markets shift, and your circumstances evolve.
Rebalancing Strategy
Over time, winning assets grow and losing assets shrink, pushing you off your target allocation.
Example:
- Target: 60% stocks, 40% bonds
- After 3 years of bull market: 70% stocks, 30% bonds (stocks grew faster)
Rebalancing: Sell stocks, buy bonds to return to 60/40. This forces you to "sell high, buy low" systematically.
How often to rebalance:
- Annual: Simple, low trading costs
- Threshold-based: Rebalance when any asset drifts more than 5% from target (e.g., stocks hit 65% when target is 60%)
- Opportunistic: Rebalance during extreme market moves (stocks drop 20%+ or rally 30%+)
(Full guide to rebalancing strategies)
Glide Path Optimization
Many retirees start with a conservative allocation (50/50) and gradually shift MORE aggressive over time (70/30 by age 80).
Why? Early retirement years have highest sequence risk. Later years benefit from equity growth (and you have less time left to recover from crashes, but also less money to lose since you've been spending down).
This is called a rising equity glide path and is supported by recent research showing it increases success rates vs. static allocations.
Optimization Constraints: Real-World Considerations
Academic optimization assumes frictionless markets. Reality has constraints:
Tax Efficiency
- Hold tax-inefficient assets (bonds, REITs) in IRAs
- Hold tax-efficient assets (index funds, muni bonds) in taxable accounts
- Rebalance in tax-advantaged accounts to avoid capital gains
Required Minimum Distributions (RMDs)
Starting at age 73, you must withdraw a percentage of your traditional IRA annually. This forces you to sell assets whether you want to or not.
Optimization adjustment: Keep more liquid assets (stocks, bonds) in IRA accounts where RMDs happen. Keep illiquid assets (REITs, alternatives) in Roth or taxable accounts.
Behavioral Constraints
The "optimal" portfolio is meaningless if you panic-sell during a crash.
Rule: Reduce allocation to the point where you can sleep at night. A 70/30 portfolio you stick with beats a 90/10 portfolio you abandon at the bottom.
Tools for Portfolio Optimization
Method 1: Target-Date Funds (Lazy, Less Optimal)
Vanguard, Fidelity, and others offer "Target Retirement" funds that automatically adjust allocation as you age.
Pros: Automatic, low maintenance
Cons: Generic (doesn't account for your personal situation), often too conservative, expensive (0.15-0.5% fees), can't customize
Method 2: Robo-Advisors (Better, Still Generic)
Betterment, Wealthfront use optimization algorithms to build portfolios based on your risk tolerance.
Pros: Automated rebalancing, tax-loss harvesting
Cons: Still one-size-fits-all, fees (0.25-0.5%), doesn't integrate with full financial plan
Method 3: DIY With Optimization Software (Best)
Use portfolio optimization tools to find your personal efficient frontier, then implement with low-cost index funds.
QuantCalc's Portfolio Optimizer lets you:
- Input up to 10 asset classes with custom return assumptions
- Use forward-looking forecasts (BlackRock, JPMorgan, Vanguard) or your own assumptions
- See your efficient frontier graphically
- Find the optimal allocation for your target return or risk level
- Export allocations to implement with your brokerage
Cost: Free for basic optimization, PRO ($99 lifetime) for forward-looking forecasts and advanced features.
How to Optimize Your Retirement Portfolio Today
Step 1: Audit your current allocation
List every account and every holding. Calculate total % in stocks, bonds, cash, other assets.
Step 2: Define your constraints
- Minimum withdrawal rate (e.g., 4% annually)
- Risk tolerance (max acceptable portfolio volatility)
- Time horizon (expected years in retirement)
Step 3: Choose your expected returns
Use forward-looking forecasts (conservative) or historical averages (optimistic). When in doubt, be conservative.
Step 4: Run optimization
Input your constraints and return assumptions into an optimizer. Get your efficient frontier and optimal allocation.
Step 5: Compare to current allocation
How far off are you? What changes would move you closer to optimal?
Step 6: Implement gradually
Don't overhaul your entire portfolio overnight. Rebalance over 3-6 months to avoid market timing risk.
Step 7: Review annually
Return assumptions change. Your circumstances change. Re-optimize each year to stay on track.
The Bottom Line
Portfolio optimization isn't about perfection—it's about being directionally correct. A portfolio 80% optimized is vastly better than one based on "60/40 sounds good."
The math is complex, but the tools are accessible. Every major pension fund and endowment uses these techniques. You should too.
Ready to optimize your portfolio? Try QuantCalc's Portfolio Optimizer to see your efficient frontier and find your optimal allocation in minutes.
Frequently Asked Questions
What is portfolio optimization for retirement?
Portfolio optimization finds the asset allocation that maximizes risk-adjusted returns for your retirement portfolio. Using techniques like mean-variance optimization (developed by Harry Markowitz), it identifies the mix of stocks, bonds, and other assets that gives you the highest expected return for a given level of risk.
What is the efficient frontier in retirement planning?
The efficient frontier is the set of portfolios that offer the highest expected return for each level of risk. Any portfolio below the frontier is suboptimal — you could get more return for the same risk or less risk for the same return. Retirement planners use it to find the ideal stock/bond split.
Should I use a 60/40 portfolio for retirement?
A 60/40 stock/bond split is a common starting point but not optimal for everyone. Your ideal allocation depends on your time horizon, risk tolerance, income needs, Social Security timing, and other income sources. Portfolio optimization tools can find your specific efficient allocation rather than defaulting to a generic split.
How often should I rebalance my retirement portfolio?
Most research suggests rebalancing annually or when allocations drift more than 5% from targets. Over-rebalancing increases transaction costs and taxes. Under-rebalancing lets risk drift upward as stocks grow. In retirement, rebalancing during withdrawals (selling the over-weighted asset class) is the most tax-efficient approach.
What is a glide path in retirement investing?
A glide path gradually shifts your asset allocation over time — typically from stocks toward bonds as you age. Unlike a static allocation, a glide path reduces risk as your time horizon shortens. Some research suggests a rising equity glide path in early retirement (starting conservative and increasing stocks) can improve portfolio survival.
How do published forecasts affect retirement portfolio optimization?
Institutional firms like Vanguard, J.P. Morgan, and Schwab publish forward-looking return estimates that often differ from historical averages. Using these forecasts rather than assuming past returns will repeat can produce more realistic retirement projections. QuantCalc compares forecasts from 6 major sources, derived from publicly available research, so you can see how different assumptions affect your optimal allocation.
Further Reading:
- Retirement Asset Allocation by Age: The Glide Path Strategy
- Retirement Portfolio Rebalancing: When and How to Do It
- What is Monte Carlo Simulation for Retirement Planning?
- Tax-Efficient Withdrawal Strategies for Early Retirees
- Stress Test Your Retirement Plan Against Crashes
Frequently Asked Questions
Portfolio optimization finds the asset allocation that maximizes risk-adjusted returns for your retirement portfolio. Using techniques like mean-variance optimization (developed by Harry Markowitz), it identifies the mix of stocks, bonds, and other assets that gives you the highest expected return for a given level of risk.
The efficient frontier is the set of portfolios that offer the highest expected return for each level of risk. Any portfolio below the frontier is suboptimal — you could get more return for the same risk or less risk for the same return. Retirement planners use it to find the ideal stock/bond split.
A 60/40 stock/bond split is a common starting point but not optimal for everyone. Your ideal allocation depends on your time horizon, risk tolerance, income needs, Social Security timing, and other income sources. Portfolio optimization tools can find your specific efficient allocation rather than defaulting to a generic split.
Most research suggests rebalancing annually or when allocations drift more than 5% from targets. Over-rebalancing increases transaction costs and taxes. Under-rebalancing lets risk drift upward as stocks grow. In retirement, rebalancing during withdrawals (selling the over-weighted asset class) is the most tax-efficient approach.
A glide path gradually shifts your asset allocation over time — typically from stocks toward bonds as you age. Unlike a static allocation, a glide path reduces risk as your time horizon shortens. Some research suggests a rising equity glide path in early retirement (starting conservative and increasing stocks) can improve portfolio survival.
Institutional firms like Vanguard, J.P. Morgan, and Schwab publish forward-looking return estimates that often differ from historical averages. Using these forecasts rather than assuming past returns will repeat can produce more realistic retirement projections. QuantCalc compares forecasts from 6 major sources, derived from publicly available research, so you can see how different assumptions affect your optimal allocation.