BlackRock, Vanguard, JPMorgan: Expect Lower Returns
BlackRock, J.P. Morgan, and Vanguard publish 10-15 year capital market expectations every year, and their 2026 forecasts cluster around 5-7% for stocks and 4-5% for bonds — well below the 7-8% most retirement calculators assume. Planning on historical averages when the institutions managing trillions expect less can overstate your success probability. This guide shows how to plan with the same forward-looking forecasts pension funds use. Run your plan on 2026 institutional forecasts free at quantcalc.app.
When you run a retirement calculator, it asks: "What return do you expect?" Most people enter 7-8% because that's what stocks "historically" return.
But here's the problem: the future isn't the past. And the world's most sophisticated investors—BlackRock, JP Morgan, Vanguard—spend millions on research to forecast future returns. Their 2026 forecasts? 5-7% for stocks, 4-5% for bonds.
Using historical returns when planning for future retirement is like driving while looking in the rearview mirror. This guide shows you how to use forward-looking forecasts—the same data that pension funds and endowments use—to build a more realistic retirement plan.
Why Historical Returns Don't Tell the Future
Run your own numbers — FREE
10,000 Monte Carlo simulations. Forward-looking forecasts from BlackRock, JPMorgan, Vanguard, GMO, Schwab, Invesco. No account needed.
Try QuantCalc Free →The standard assumption:
- Stocks: ~10% annual return (1926-present)
- Bonds: ~5% annual return
- Plug these into retirement calculator, get answer
Why this is wrong:
1. Valuations Matter
Historical average P/E ratio: ~15-17. Today's P/E: ~25-30. High valuations predict lower future returns.
Research (Shiller CAPE, mean-reversion literature, GMO 7-Year Forecasts): When CAPE ratio is above 25, subsequent 10-year returns average 3-6%, not 10%.
2. Bond Yields Are Structural Inputs
Bond returns are ~85% predictable based on starting yield.
- Historical bond yields: 5-7%
- 2020-2024 yields: 0-3%
- 2026 yields: 4-5%
Result: Future bond returns will be 4-5%, not the historical 5-7%.
3. Mean Reversion is Real
Periods of high returns are followed by periods of low returns (and vice versa).
- 2010-2021: Stocks +15%/year (best decade ever)
- Implication: Next decade likely below average
Using 10% stock returns after the best decade ever is optimistic bias, not prudent planning.
What Are forward-looking forecasts?
forward-looking forecasts are 10-15 year expected return estimates published annually by major investment firms.
Who publishes them:
- BlackRock
- JPMorgan Asset Management
- Vanguard
- GMO (Grantham Mayo Van Otterloo)
- Charles Schwab
- Invesco
- Morningstar
What they forecast:
- Expected returns for stocks, bonds, REITs, commodities, international markets
- By asset class (US large-cap, small-cap, emerging markets, etc.)
- Inflation assumptions
- Volatility (standard deviation)
How they're built:
- Valuation models (P/E ratios, dividend yields, earnings growth)
- Economic forecasts (GDP, inflation, interest rates)
- Demographic trends
- Historical return patterns
Why institutions use them:
Pension funds and endowments are legally required to use realistic return assumptions for long-term planning. They can't use "stocks return 10% because history" when current conditions suggest 6%.
2026 forward-looking forecast Consensus
Here's what major firms are forecasting for the next 10 years (as of 2026):
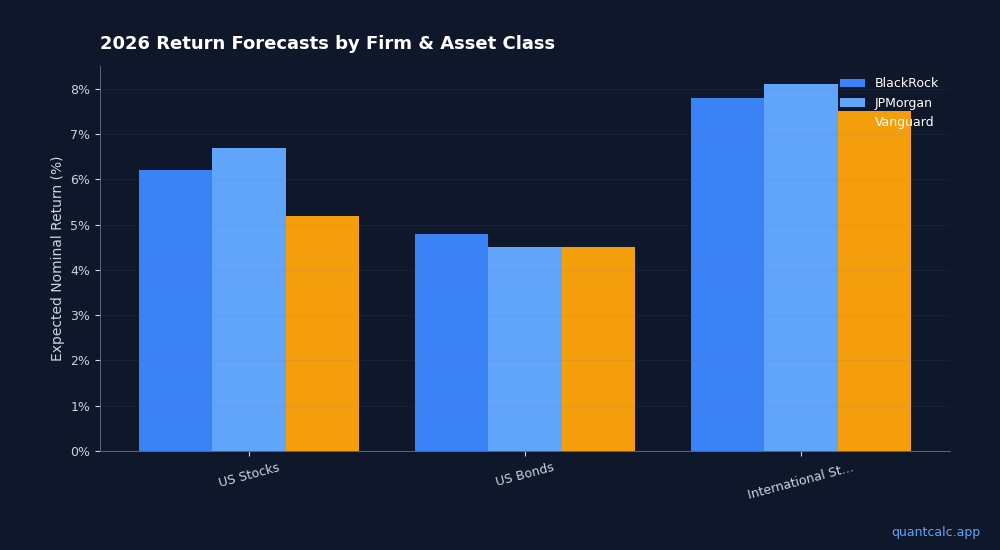
US Stocks (Large Cap)
- BlackRock: 6.2% nominal, 3.7% real (after inflation)
- JPMorgan: 6.7% nominal, 4.2% real
- Vanguard: 4.2-6.2% nominal
- GMO: 0-3% real (most pessimistic—they account for valuation extremes)
Consensus: ~5.5-6.5% nominal returns
Why lower than historical 10%?
- High starting valuations (P/E ~25)
- Lower earnings growth expected (demographics, debt)
- Profit margins at all-time highs (likely to mean-revert)
US Bonds (Aggregate)
- BlackRock: 4.8% nominal
- JPMorgan: 4.5% nominal
- Vanguard: 4.0-5.0% nominal
Consensus: ~4-5% nominal returns
Why? Bond returns ≈ starting yield. 10-year Treasury at 4.5% = 4.5% expected return.
International Stocks
- BlackRock: 7.8% nominal (higher than US due to lower valuations)
- JPMorgan: 8.1% nominal
- Vanguard: 6.5-8.5% nominal
Consensus: ~7-8% nominal returns (valuation advantage over US)
REITs
- Forecasts: 5.5-6.5% nominal
Inflation
- Consensus: 2.5-3.0% long-term
How to Use forward-looking forecasts in Your Retirement Plan
Step 1: Choose Which Forecast to Use
Option A: Use consensus average
- US stocks: 6%
- Bonds: 4.5%
- International: 7.5%
Option B: Use a specific firm's forecast
- If you trust BlackRock's methodology, use their numbers
- If you're pessimistic, use GMO's lower estimates
Option C: Blend historical and current forecasts
- 50% historical (10% stocks) + 50% forward-looking (6% stocks) = 8% blended
- More optimistic than pure forward-looking, more conservative than pure historical
My recommendation: Use forward-looking forecasts (Option A or B). You're planning for the FUTURE, not the past.
Step 2: Adjust Your Asset Allocation
If you were assuming 10% stock returns and now you're using 6%, your portfolio might not grow as expected.
Two options:
Option 1: Accept lower returns, plan accordingly
- Withdraw less (3-3.5% instead of 4%)
- Save more before retiring
- Work 1-2 years longer
Option 2: Increase stock allocation (to chase higher returns)
- Shift from 60/40 to 70/30 or 80/20
- Increases expected return BUT also increases volatility and sequence risk
My recommendation: Option 1 (lower withdrawal rate) is safer than Option 2 (gambling on higher risk to compensate).
(Portfolio optimization guide)
Step 3: Test Multiple Scenarios
Don't plan for just one forecast. Test multiple:
Optimistic scenario (historical returns):
- Stocks: 10%, Bonds: 5%
- What's your success rate? (Probably 95%+)
Base case (consensus):
- Stocks: 6%, Bonds: 4.5%
- What's your success rate? (Target 85-90%)
Pessimistic scenario (GMO-style):
- Stocks: 3%, Bonds: 4%
- What's your success rate? (If this is above 70%, you're well-protected)
The goal: Your plan should succeed in the base case and survive even in the pessimistic case.
Step 4: Model It With Monte Carlo
forward-looking forecasts give you expected returns, but Monte Carlo shows you the distribution of outcomes.
QuantCalc PRO integrates live forward-looking forecast data:
- One-click selection: BlackRock, JPMorgan, Vanguard, GMO forecasts
- Compare your plan using different published assumptions
- See how success rates change with conservative vs. optimistic forecasts
Example output:
- Using historical data (10% stocks): 92% success
- Using BlackRock forecast (6.2% stocks): 84% success
- Using GMO forecast (3% stocks): 71% success
Insight: If your plan only works with 10% returns, it's not robust. Adjust spending or allocation.
Real-World Example: How Forecasts Change Your Plan
Meet Carlos, age 60:
- Portfolio: $1.5M (60/40 stocks/bonds)
- Planned spending: $65k/year
- Retirement age: 62
- Time horizon: 30 years
Scenario A: Historical Returns (10% stocks, 5% bonds)
Expected portfolio return: 7.5%
Monte Carlo result:
- Success rate: 94%
- Median ending balance: $2.1M
- Carlos thinks: "I'm golden!"
Scenario B: forward-looking forecasts (6% stocks, 4.5% bonds)
Expected portfolio return: 5.4%
Monte Carlo result:
- Success rate: 79% (borderline risky)
- Median ending balance: $600k
- 10th percentile: Ran out of money at age 85
Carlos's wake-up call: His plan only worked assuming historical returns. With realistic forecasts, he has a 21% chance of running out of money.
Carlos's Adjustments:
Option 1: Cut spending to $60k/year → Success rate jumps to 88%
Option 2: Work until 64 (2 extra years) → Success rate jumps to 91%
Option 3: Shift to 70/30 allocation → Success rate 83% (helps, but riskier)
Carlos's decision: Work until 63 (1 extra year) + cut spending to $62k → Success rate: 90%
Result: Using forward-looking forecasts saved Carlos from a 21% risk of running out of money.
forward-looking forecasts Are Not Perfect
They're wrong often: Forecasts are probabilistic, not prophecies. The next 10 years might be better OR worse than forecasted.
Why use them anyway?
- They're based on current conditions (valuations, yields, fundamentals)
- They're more realistic than assuming "history repeats"
- They're conservative (which is appropriate for retirement planning)
The right mindset: Forecasts are not "truth"—they're a scenario to test. If your plan fails with forward-looking forecasts, it's too fragile.
How to Access forward-looking forecasts
Public Sources:
- BlackRock Capital Market Assumptions — as widely reported in financial press (e.g., Morningstar's annual "Experts Forecast Stock and Bond Returns" roundup by Christine Benz)
- Vanguard Economic and Market Outlook (vanguard.com/outlook)
- JPMorgan Long-Term Capital Market Assumptions (annual publication, PDF available)
- GMO 7-Year Asset Class Forecasts — headline figures widely reported in financial press (Reuters, Bloomberg, FT) based on GMO's 7-Year Asset Class Forecasts
- Charles Schwab Long-Term Capital Market Expectations (schwab.com/learn — public consumer page)
- Invesco Capital Market Assumptions (invesco.com — public PDFs)
Integrated in Software:
- QuantCalc PRO (BlackRock, JPMorgan, Vanguard forecasts built-in, updated live)
- RightCapital (advisor software with institutional data)
- eMoney (advisor software with customizable return assumptions)
Should You Update Forecasts Annually?
Yes and no.
Yes:
- forward-looking forecasts are updated annually (usually in November/December)
- If forecasts change dramatically (e.g., bond yields spike 3%), your plan might need adjustment
No:
- Don't panic-adjust every year based on minor forecast tweaks
- Retirement planning is long-term—small annual changes don't matter much
Best practice:
- Annual review: Check if forecasts have changed significantly
- Major adjustment trigger: If expected returns drop 1-2%+ from when you originally planned, rerun your Monte Carlo and consider adjustments
- Otherwise: Stick to your plan, monitor actual portfolio performance vs. expectations
The Most Important Forecast: Sequence Risk
Here's what matters more than average returns: the ORDER of returns in your first 5-10 years.
Scenario 1: Good sequence
- Markets return 6% average over 30 years, with strong early years → You're fine
Scenario 2: Bad sequence
- Markets return 6% average, but crash 40% in year 2 → You might run out of money
forward-looking forecasts give you the average, Monte Carlo shows you the sequence risk.
QuantCalc models both:
- Uses forward-looking forecast averages
- Runs 10,000 simulations with randomized sequences
- Shows you: "With BlackRock's 6% stock forecast, you have 87% success across all sequences"
(Learn more about sequence of returns risk)
The Bottom Line: Plan for the Future, Not the Past
Historical returns are a comforting lie. Using 10% stock assumptions when the world's best investors are forecasting 6% is retirement planning on hard mode.
forward-looking forecasts aren't perfect—but they're far better than "stocks always return 10% because 1926-2023 average."
Use forward-looking forecasts to:
- Set realistic expectations
- Stress-test your plan
- Make informed trade-offs (spend less, work longer, adjust allocation)
The retirees who succeed: Plan conservatively, test multiple scenarios, and build margin for error.
The retirees who fail: Assume 10% returns because "that's what stocks do," then retire into a decade of 4% returns.
Ready to stress-test your retirement with realistic return assumptions? Try QuantCalc PRO with live BlackRock, JPMorgan, and Vanguard forecasts—see how your plan holds up across thousands of scenarios.
Further Reading: