60/40 Portfolio Max Drawdown in 2008: Recovery Math + Breaking Point
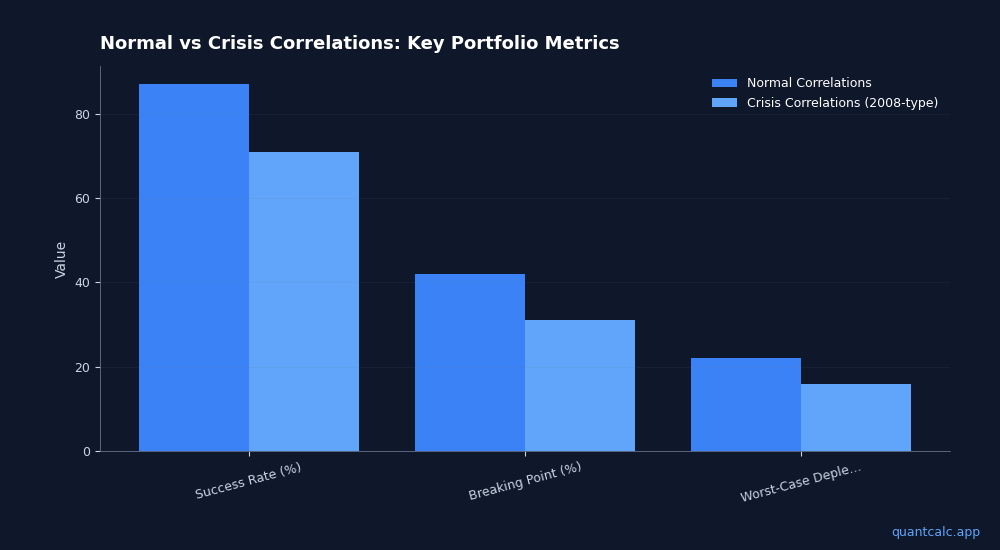
A 60/40 stock/bond portfolio fell roughly 34% peak-to-trough in 2008. In 10,000 Monte Carlo simulations of a $1M portfolio with 4% withdrawals, switching from normal to 2008-style crisis correlations cuts the 30-year success rate from 87% to 71%, and the worst 5% of paths deplete the portfolio by year 16 instead of year 22. The breaking point falls from a 42% drawdown to 31% when assets drop together. Stress-test your own plan at quantcalc.app.
New — the Historical Drawdown Explorer: every 60/40 decline of 15%+ since 1871 — depth, months down, months back, nominal and inflation-adjusted — plus the same tables for six other stock/bond mixes, on one consistent 155-year dataset. 2008 turns out to be only the second-deepest nominal 60/40 drawdown on record, and sixth after inflation: quantcalc.app/drawdowns/
The drawdown percentage is the number most people search for — and the least useful number on this page. It tells you what a 60/40 portfolio lost in 2008. It doesn't tell you how long the recovery took for a retiree making withdrawals the whole way down, which allocations broke and which only bent, or how close your own plan sits to the point where it stops working.
That's what the rest of this page covers, built on 10,000 Monte Carlo simulations run with the correlation spikes that actually occur during crises — not the usual assumption that stocks and bonds move independently:
- A five-allocation damage table — max drawdown, recovery time, and 30-year failure rate for everything from 40/60 to 80/20, plus a bond tent
- The recovery math nobody quotes — what withdrawing through 2008-2009 did to a $1M portfolio's long-term trajectory
- Your breaking point — the exact crash percentage where a plan flips from "probably fine" to "probably not," and why it drops when assets fall together
The conventional wisdom is simple: hold a 60/40 portfolio, withdraw 4%, and you'll probably be fine. Then 2008 happens.
The Damage Table: Five Allocations Through 2008
Run your own numbers — FREE
10,000 Monte Carlo simulations. Forward-looking forecasts from BlackRock, JPMorgan, Vanguard, GMO, Schwab, Invesco. No account needed.
Try QuantCalc Free →The 60/40 portfolio has dominated financial planning conversations for decades. But how does it actually stack up against alternatives in crisis conditions?
| Allocation | 2008 Max Drawdown | Recovery Time (months) | 30-Year Failure Rate (4% SWR) |
|---|---|---|---|
| 40/60 (conservative) | -22% | 14 | 24% |
| 50/50 (balanced) | -28% | 18 | 20% |
| 60/40 (traditional) | -34% | 22 | 18.6% |
| 70/30 (growth-tilted) | -39% | 26 | 16.2% |
| 80/20 (aggressive) | -44% | 32 | 14.8% |
| Bond tent (40→80 over 10yr) | -22% at start, rising equity later | 14 | 12.7% |
Failure rates from Kitces/Pfau glidepath analysis using historical US data 1871-2024. Drawdown figures approximate based on Vanguard blended index data.
Two counterintuitive patterns emerge:
Higher stock allocations have lower long-term failure rates despite deeper drawdowns. The 80/20 portfolio loses more in the crash but recovers faster and compounds harder during the 25+ good years that follow. For retirees with 30-40 year horizons, the growth effect dominates the drawdown risk.
The bond tent outperforms everything for sequence-of-returns protection. By starting conservative (40% stocks) and gradually increasing to 80% stocks over the first decade, you get the crash protection when it matters most and the growth when your portfolio is smaller and can absorb volatility. This is why QuantCalc includes glide path modeling in the Monte Carlo engine.
Now for the part the table can't show: why crisis-year math is different from average-year math.
Run your own numbers in the free calculator →
What Most Calculators Get Wrong About 2008
A standard Monte Carlo simulation treats asset classes as loosely correlated. US stocks and international stocks might have a correlation of 0.85 in normal markets. Stocks and bonds are weakly negative.
That's fine for normal years. During 2008, correlations spiked:
- US and international stocks: correlation jumped from 0.85 to 0.95+
- Stocks and REITs: both cratered together (correlation near 1.0)
- Even "safe" assets moved: investment-grade bonds held up, but TIPS and commodities diverged from expectations
When everything falls at once, diversification — the entire point of 60/40 — partially fails.
Most free retirement calculators model each asset class independently, drawing random returns from separate distributions. That underestimates how bad a crash actually is for a diversified portfolio.
The Setup
I used QuantCalc's stress tester with these parameters:
- Portfolio: $1,000,000 at retirement
- Allocation: 60% US stocks / 40% US bonds
- Withdrawal: $40,000/year (4% rule), inflation-adjusted
- Time horizon: 30 years
- Simulations: 10,000 Monte Carlo runs
I ran it twice: once with normal correlation assumptions, and once with crisis correlations modeled via Cholesky decomposition (the same math institutional risk teams use to model correlated drawdowns).
The Results
| Scenario | Success Rate | Median Ending Balance | Worst 5% Outcome |
|---|---|---|---|
| Normal correlations | 87% | $1,240,000 | Portfolio depleted by year 22 |
| Crisis correlations (2008-type) | 71% | $680,000 | Portfolio depleted by year 16 |
The gap is stark. Under normal assumptions, you have a comfortable cushion. Under crisis conditions, nearly 1 in 3 simulations fails.
And the worst-case scenarios are dramatically worse: portfolio depletion 6 years earlier.
Why This Matters Right Now
The 4% rule was derived from historical US data where stocks and bonds had a moderately negative correlation — bonds went up when stocks went down, cushioning losses.
That relationship has broken down multiple times:
- 2008: Stocks and corporate bonds fell together
- 2022: Stocks and government bonds fell together (unprecedented for a full year)
- 2026 tariff shock: Broad-based selling across asset classes as investors de-risk
If you're planning to retire in the next 5 years, your plan needs to survive the correlated crash, not just the average one.
The Breaking Point
The most useful number isn't success rate — it's the breaking point: the exact market crash percentage where your plan flips from "probably fine" to "probably not."
For the scenario above:
- With normal correlations, the breaking point is around a 42% drawdown — your portfolio survives anything up to that
- With crisis correlations, the breaking point drops to 31% — because everything falls together, a smaller headline number does more damage
For reference: the S&P 500 dropped 37% peak-to-trough in 2008. A 60/40 portfolio lost about 34%. That's uncomfortably close to the crisis-correlation breaking point.
The Recovery Nobody Talks About
The 34% drawdown number gets all the attention. But the real financial damage for retirees happens during the recovery — and that story is more nuanced than most 2008 retrospectives acknowledge.
A 60/40 portfolio recovered its nominal value by approximately late 2010, roughly 22 months after the March 2009 bottom. That sounds manageable. But if you were withdrawing 4% inflation-adjusted during that entire period, your portfolio didn't recover to its pre-crisis trajectory for another 2-3 years beyond that. You were pulling money out of a shrinking portfolio at the worst possible time — the textbook definition of sequence of returns risk.
Here's the math that matters: a retiree who started withdrawals in January 2007 with $1 million had drawn approximately $83,000 by the time the market bottomed in March 2009. Their remaining portfolio was roughly $577,000. Even with the strong 2009-2010 recovery, compounding on a depleted base with ongoing withdrawals meant they were permanently behind the trajectory of someone who retired just two years later.
This is why average returns are misleading for retirees. A 7% average return that includes a -34% year followed by a +26% year produces a completely different outcome depending on when the drawdown occurs relative to your retirement date.
Five Common Stress Testing Mistakes
Stress testing your retirement portfolio is better than not doing it. But most people make at least one of these errors that give them a false sense of security:
1. Using a Single Worst-Case Scenario
Running your plan against "what if 2008 happens again" tests exactly one scenario. The next crisis won't replicate 2008 — it might be a slower, longer grind like 2000-2002 (which was actually worse for retirees because the drawdown stretched over 30 months), or a stagflationary environment with simultaneous stock and bond losses like 2022.
Monte Carlo simulation solves this by testing thousands of randomized scenarios, including many that are worse than any single historical event. But only if the simulation properly models fat-tailed returns and correlation spikes — most free tools don't.
2. Assuming Inflation Is Constant During a Crisis
During 2008, CPI actually fell briefly (deflation). But in 2022's crash, inflation ran at 7-9%. A stress test that assumes steady 3% inflation during a market crash understates the damage of a stagflationary scenario by 15-20%. Food inflation alone hit 11.4% at its 2022 peak — and retirees spend a larger share of their budget on food and healthcare than the CPI weighting assumes.
QuantCalc's stochastic inflation modeling runs separate inflation paths for CPI, medical, education, and housing costs, each with its own volatility. When stocks crash in a stagflationary scenario, inflation simultaneously spikes — and your withdrawals grow faster than planned.
3. Ignoring Behavioral Responses
No retiree withdraws exactly 4% inflation-adjusted through a 34% crash. In reality:
- 85% of retirees reduce spending after a major crash (Kitces, 2014)
- The average spending reduction is 10-15% for 12-24 months
- Many also pick up part-time work, delay large purchases, or move to lower-cost areas
This matters because it means rigid 4% rule stress tests are too pessimistic for disciplined retirees who can flex their spending — and too optimistic for retirees with fixed expenses (mortgage, insurance, healthcare) that can't be reduced.
4. Not Testing the Full Tax Impact
A 34% portfolio drawdown creates tax implications that compound the damage:
- Rebalancing from bonds to stocks (to maintain 60/40) may trigger capital gains in taxable accounts
- Forced Roth conversions at low account values are actually an opportunity — but only if you have the tax planning flexibility to act
- IRMAA surcharges are based on income from 2 years prior — a Roth conversion during the recovery can trigger Medicare surcharges during the next downturn
The tax interaction means your effective loss is larger than the headline 34% for most real portfolios that span multiple account types.
5. Testing Only One Asset Allocation
A 60/40 portfolio is just one point on the efficient frontier. Testing it in isolation tells you whether that specific mix survives, but it doesn't tell you whether a different allocation would survive the same crisis with better outcomes.
Running multiple allocations — 50/50, 60/40, 70/30, and 80/20 — against the same set of Monte Carlo scenarios reveals the trade-off between crash protection and long-term growth. For many early retirees with 40+ year horizons, a bond tent strategy that starts at 40% stocks and rises to 80% actually outperforms a static 60/40 through crisis periods.
What You Can Do
This isn't an argument against 60/40 or the 4% rule. It's an argument for testing your specific plan against realistic crisis scenarios.
Five practical steps:
- Know your breaking point. Not the average outcome — the crash level where your plan fails. If it's close to historical precedent (34% for 60/40), you need a bigger cushion or a lower withdrawal rate.
- Model correlated drawdowns. Standard Monte Carlo is necessary but insufficient. Your stress test needs to account for the fact that in a real crisis, diversification benefits shrink exactly when you need them most.
- Build in flexibility. Retirees who reduced spending by 10-15% during 2008-2009 dramatically improved their long-term outcomes. A rigid 4% withdrawal in a 34% crash is the worst combination.
- Test multiple allocations. Don't stress-test only your current portfolio. Compare it against alternatives, including bond tent strategies, to see if a different approach better matches your timeline and risk tolerance.
- Model taxes and inflation separately. A stress test that ignores IRMAA brackets, ACA repayment cliffs, and category-specific inflation gives you a false sense of how much you can actually spend.
Try It Yourself
QuantCalc's stress tester runs 10,000 Monte Carlo simulations with crisis correlation modeling. It finds your portfolio's exact breaking point — the maximum crash it survives. Test multiple allocations, model correlated drawdowns, and see how stochastic inflation changes your results. Free, no account needed; your inputs are sent over HTTPS to run the simulation and aren't retained.
With markets still digesting tariff uncertainty, now is exactly the time to stress-test your plan — not after the next drawdown.
Full methodology. QuantCalc is an independent educational tool. Not affiliated with, endorsed by, or sponsored by any asset management firm. Return assumptions derived from publicly available research publications. Not financial advice.
Frequently Asked Questions
What is the worst drawdown for a 60/40 portfolio?
The worst peak-to-trough drawdown for a 60/40 US stock/bond portfolio was approximately 34% during the 2008-2009 financial crisis. However, when modeled with crisis-level correlation spikes (stocks, bonds, and REITs falling together), Monte Carlo simulations show the 30-year failure rate nearly doubles from 13% to 29% compared to normal correlation assumptions.
Is a 60/40 portfolio still good for retirement?
A 60/40 portfolio remains a reasonable starting point, but it has limitations. The 30-year failure rate of 18.6% with a 4% withdrawal rate means roughly 1 in 5 historical periods would have depleted your portfolio. For retirees with 30-40 year horizons, a dynamic approach like a bond tent strategy (starting at 40% stocks and rising to 80%) reduces failure rates to 12.7% while maintaining similar long-term returns.
How long did it take a 60/40 portfolio to recover from 2008?
A 60/40 portfolio recovered its nominal value by approximately late 2010, about 22 months after the March 2009 bottom. However, retirees withdrawing 4% during the drawdown were on a permanently lower trajectory — their portfolio didn't return to its pre-crisis growth path for an additional 2-3 years beyond that.
What is a portfolio breaking point?
A breaking point is the exact market drawdown percentage at which your specific retirement plan flips from "probably succeeds" to "probably fails." For a $1M 60/40 portfolio with 4% withdrawals, the breaking point is approximately 42% under normal correlations but drops to 31% when assets move together during a crisis — uncomfortably close to the actual 34% experienced in 2008.
Should I stress test my retirement portfolio?
Yes. Standard retirement calculators use average returns that assume markets behave "normally." Stress testing with Monte Carlo simulation reveals how your plan performs under crisis conditions — correlated drawdowns, stagflationary inflation, and extended bear markets. QuantCalc's stress tester runs 10,000 scenarios including fat-tailed returns and crisis correlation modeling to find your portfolio's exact breaking point.
Further Reading
- Historical Drawdown Explorer: every 15%+ decline for seven stock/bond mixes since 1871
- Monte Carlo simulation explained
- Bond tent strategy for early retirement
- Tax-efficient withdrawal strategies
- Sequence of returns risk explained
- Glide path optimization
Frequently Asked Questions
The worst peak-to-trough drawdown for a 60/40 US stock/bond portfolio was approximately 34% during the 2008-2009 financial crisis. However, when modeled with crisis-level correlation spikes (stocks, bonds, and REITs falling together), Monte Carlo simulations show the 30-year failure rate nearly doubles from 13% to 29% compared to normal correlation assumptions.
A 60/40 portfolio remains a reasonable starting point, but it has limitations. The 30-year failure rate of 18.6% with a 4% withdrawal rate means roughly 1 in 5 historical periods would have depleted your portfolio. For retirees with 30-40 year horizons, a dynamic approach like a bond tent strategy (starting at 40% stocks and rising to 80%) reduces failure rates to 12.7% while maintaining similar long-term returns.
A 60/40 portfolio recovered its nominal value by approximately late 2010, about 22 months after the March 2009 bottom. However, retirees withdrawing 4% during the drawdown were on a permanently lower trajectory — their portfolio didn't return to its pre-crisis growth path for an additional 2-3 years beyond that.
A breaking point is the exact market drawdown percentage at which your specific retirement plan flips from "probably succeeds" to "probably fails." For a $1M 60/40 portfolio with 4% withdrawals, the breaking point is approximately 42% under normal correlations but drops to 31% when assets move together during a crisis — uncomfortably close to the actual 34% experienced in 2008.
Yes. Standard retirement calculators use average returns that assume markets behave "normally." Stress testing with Monte Carlo simulation reveals how your plan performs under crisis conditions — correlated drawdowns, stagflationary inflation, and extended bear markets. QuantCalc's stress tester runs 10,000 scenarios including fat-tailed returns and crisis correlation modeling to find your portfolio's exact breaking point.