Why Running 50 Monte Carlo Simulations Is Not Enough
You plugged your numbers into a retirement calculator. It said you have a 92% chance of success. You felt good.
But that number might be meaningless — depending on how many simulations the calculator actually ran.
What Monte Carlo Simulation Does for Retirement Planning
Run your own numbers — FREE
10,000 Monte Carlo simulations. Forward-looking forecasts from BlackRock, JPMorgan, Vanguard, GMO, Schwab, Invesco. No account needed.
Try QuantCalc Free →Traditional retirement calculators use a single average return — say, 7% per year — and project a straight line into the future. The problem: markets don't move in straight lines. A 30% crash in year 2 of retirement is catastrophic. The same crash in year 25 barely registers.
Monte Carlo simulation solves this by running your retirement plan through hundreds or thousands of randomized market scenarios. Each simulation uses different sequences of returns, inflation rates, and volatility. The result is not one number but a probability distribution: "In 85% of scenarios, your money lasted 30 years."
This approach captures sequence of returns risk — the single biggest threat to early retirees and anyone drawing down a portfolio.
Run your own numbers in the free calculator →
The Simulation Count Problem
Here's what most people don't realize: the number of simulations matters enormously.
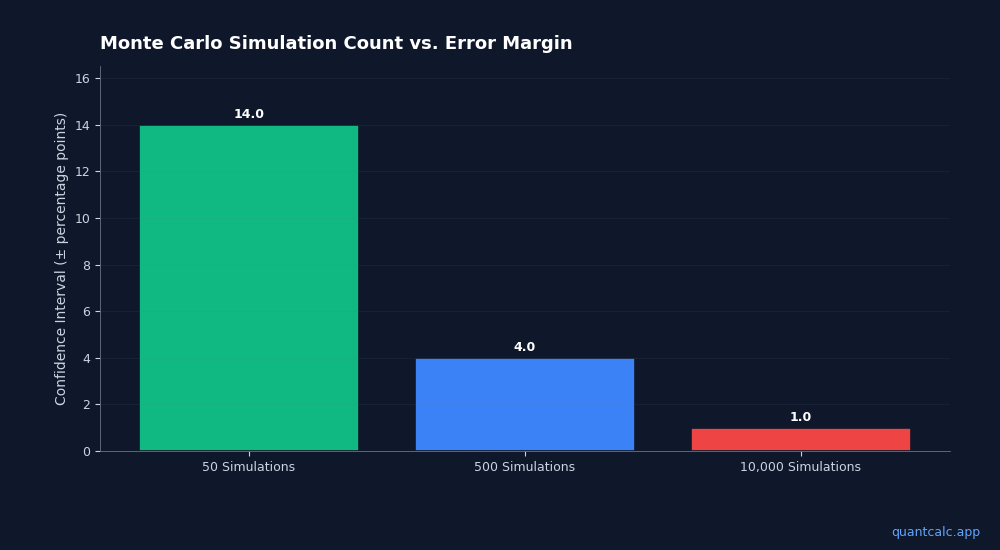
50 simulations (common in free tools): The confidence interval around your success rate is roughly +/- 14 percentage points. A reported "90% success rate" could actually be anywhere from 76% to 100%. That's not a plan — that's a guess.
500 simulations: The margin tightens to about +/- 4 percentage points. Better, but still noisy. Run the same inputs twice and you'll get different results.
10,000 simulations: The margin drops to roughly +/- 1 percentage point. Now your 89% success rate is stable, reproducible, and genuinely useful for making decisions about your retirement date, spending, and asset allocation.
The math is straightforward: statistical confidence scales with the square root of sample size. To cut your error margin in half, you need 4x the simulations.
What Changes With More Simulations
Beyond just a tighter confidence interval, higher simulation counts reveal patterns that low counts miss:
Tail risk visibility. With 50 simulations, you might never generate the 2008-level crash that happens in the first year of your retirement. With 10,000 simulations, you'll see dozens of such scenarios — and you'll know exactly how your plan handles them.
Glide path sensitivity. The difference between a 70/30 and 60/40 stock-bond allocation in year one of retirement might look identical in 100 simulations. At 10,000 simulations, the difference in portfolio optimization outcomes becomes statistically visible.
Withdrawal rate precision. The classic "4% rule" comes from historical backtesting. Monte Carlo gives you forward-looking probabilities. But only at high simulation counts can you meaningfully compare 3.5% vs 3.8% vs 4.0% withdrawal rates — the differences in success probability might be 2-3 percentage points, invisible below 1,000 simulations.
Beyond Simple Monte Carlo
Simulation count is not the only thing that matters. The assumptions baked into those simulations are equally critical:
Return assumptions. Does your calculator use historical averages (which assume the future looks like the past) or forward-looking estimates from publicly available research? CME FedWatch data, BlackRock Capital Market Assumptions, Vanguard's economic outlook, JPMorgan's Long-Term Capital Market Assumptions, and GMO's 7-year forecasts all provide different forward-looking return estimates. A calculator that lets you compare forward-looking forecasts gives you a realistic range rather than a single hopeful number.
Correlation modeling. Stocks and bonds don't move independently. A Monte Carlo calculator that treats them as uncorrelated overstates the benefit of diversification. Look for one that models asset correlations.
Tax-aware modeling. Your retirement income isn't just investment returns. It includes Social Security, pensions, Roth conversions, and required minimum distributions — each taxed differently. A Monte Carlo simulation that ignores tax-efficient withdrawal strategies can overestimate your real spending power by 15-20%.
Inflation variability. Fixed 3% inflation assumptions miss the reality that inflation varies dramatically year to year. The best Monte Carlo calculators simulate variable inflation alongside variable returns.
How to Choose a Monte Carlo Retirement Calculator
When evaluating tools, check these five things:
- Simulation count. Anything below 500 is noise. 1,000 is the minimum for useful results. 10,000 gives you confidence.
- Return assumptions. Can you input your own, or are you stuck with one set of historical averages?
- Asset allocation flexibility. Can you model a glide path that shifts over time, or only a fixed allocation?
- Tax modeling. Does it account for different tax treatment of traditional vs. Roth accounts, capital gains, and Social Security taxation?
- Transparency. Can you see the underlying assumptions, or is it a black box?
Run Your Own 10,000-Simulation Analysis
QuantCalc runs 10,000 Monte Carlo simulations in your browser — no signup, no data sent to any server. The free tier gives you 100 simulations to explore. PRO unlocks the full 10,000 along with forward-looking forecast comparisons from multiple research firms, portfolio optimization, glide path modeling, and PDF report export.
Your retirement is too important for a 50-simulation guess. Run the numbers properly.