Your Retirement Calculator Assumes 3% Inflation. What If Food Hits 8%?
Every retirement calculator has an inflation input. Most default to 3%. Some let you pick 2-4%. Nearly all treat inflation as a single number applied uniformly across your entire spending.
That's not how inflation works. And in 2026, the gap between "average inflation" and "your actual inflation" could break a retirement plan that looks safe on paper.
The Problem with One Number
Run your own numbers — FREE
10,000 Monte Carlo simulations. Forward-looking forecasts from BlackRock, JPMorgan, Vanguard, GMO, Schwab, Invesco. No account needed.
Try QuantCalc Free →The Consumer Price Index (CPI) is an average across hundreds of categories weighted by the "typical" consumer. When the Fed reports 3.2% inflation, that number blends:
- Housing: Up 4.5% (rent and owners' equivalent rent dominate CPI weighting)
- Food at home: Up 6-8% in recent months
- Healthcare: Up 5-7% annually (and accelerating for early retirees post-ACA cliff)
- Energy: Volatile — up 15% one year, flat the next
- Electronics: Often negative (quality adjustments)
- Apparel: Nearly flat
If you're a 55-year-old early retiree who owns their home outright, the "housing" component barely affects you. But food, healthcare, and energy — the categories that hit retirees hardest — are running well above the CPI average.
The 2026 Food Price Setup
Spring 2026 brought a structural shock most people haven't priced in yet.
Global fertilizer prices surged 43-75% due to supply disruptions. This hit during the critical March-April planting window in the Northern Hemisphere. Farmers responded rationally: they switched from nitrogen-intensive corn to soybeans, which require less fertilizer. The result is locked in — reduced corn acreage means lower grain yields regardless of weather.
The timeline: spring 2026 planting decisions → fall 2026 harvest shortfall → Q4 2026/Q1 2027 grocery price increases as supply tightens.
Oil above $100/barrel compounds the problem. Transportation costs flow through to every item in the grocery store. Higher diesel means higher delivery costs. Higher natural gas (feedstock for nitrogen fertilizer) means the fertilizer crisis persists into 2027.
This isn't speculation. The planting decisions are made. The acreage is committed. The harvest math is arithmetic.
What This Means for Retirement Plans
A retiree spending $60,000/year with a 30-year horizon and a 3% inflation assumption projects needing roughly $145,000/year by year 30.
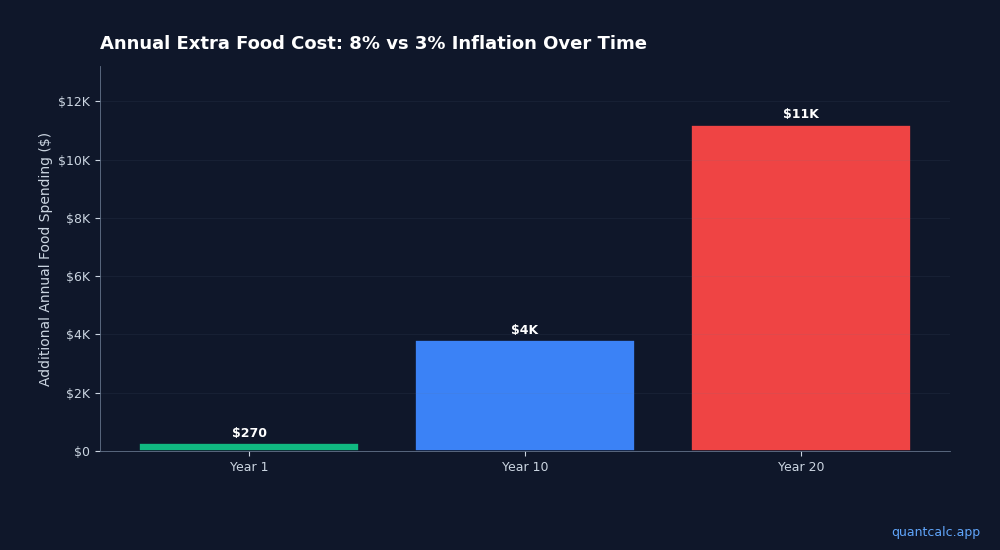
Change food inflation to 8% (only on the food portion — roughly 15% of spending) while keeping everything else at 3%:
- Year 1 difference: $270 more in food costs
- Year 10 difference: $3,800 more per year
- Year 20 difference: $11,200 more per year
- Year 30 cumulative difference: $127,000 in additional lifetime food spending
That $127,000 isn't a rounding error. It's the difference between a 92% success rate and an 81% success rate in a Monte Carlo simulation — depending on sequence of returns.
The Healthcare Multiplier
Food inflation alone doesn't break plans. But stack it with healthcare:
In 2026, early retirees face the return of the ACA subsidy cliff. A couple retiring at 55 can expect to spend $380,000+ on healthcare before Medicare eligibility at 65. That's with ACA subsidies. Without them (income above 400% FPL), add another $150,000-$250,000.
Healthcare inflation historically runs 5-7% annually. Combined with food at 6-8% and energy volatility, a retiree's personal inflation rate could be 5-6% while "official" CPI reads 3.2%.
Run Monte Carlo simulations at 3% and then at 5.5%. The difference in success probability is typically 15-25 percentage points. That's the gap between "you're fine" and "you need to go back to work at 72."
Why Most Calculators Can't Model This
Standard retirement calculators apply one inflation rate to one spending number. They can't model:
- Category-specific inflation (food at 8%, housing at 2%, healthcare at 6%)
- Spending pattern shifts over time (travel-heavy early retirement → medical-heavy late retirement)
- Inflation correlation with market returns (high inflation often coincides with poor stock returns — the stagflation scenario)
- ACA subsidy interactions (higher inflation → higher cost of living → pressure to withdraw more → higher MAGI → lost healthcare subsidies)
The last point is the most dangerous feedback loop for early retirees. Inflation forces larger withdrawals. Larger withdrawals push MAGI above the ACA cliff. Lost subsidies increase healthcare costs. Higher healthcare costs require even larger withdrawals. It compounds.
How to Stress-Test Against Real Inflation
Step 1: Disaggregate your spending. Don't use one number. Break your budget into: housing, food, healthcare, transportation, discretionary. Weight each category by your actual spending pattern.
Step 2: Apply category-specific inflation rates. Use 2-3% for housing (if you own), 5-7% for healthcare, 4-6% for food/energy, 2-3% for discretionary.
Step 3: Run Monte Carlo simulations at multiple overall rates. At minimum, test 3% (base case), 4.5% (moderate stress), and 6% (stagflation scenario). Compare success probabilities across all three.
Step 4: Model the ACA feedback loop. If higher inflation forces larger withdrawals, does your MAGI cross the 400% FPL threshold? If so, add $15,000-$25,000 in annual healthcare costs to your stress scenario.
Step 5: Check forward-looking forecasts. Not every decade will look like 2010-2020. CME market-implied inflation expectations, BlackRock's capital market assumptions, and JPMorgan's long-term forecasts all offer different inflation outlooks. A retirement plan calibrated against multiple professional forecasts is more robust than one built on a hope that 3% holds for 30 years.
The Bottom Line
The retirees who get hurt by inflation aren't the ones who expected it. They're the ones whose calculators told them 3% was "conservative enough."
A 3% assumption was reasonable from 2010-2020. In 2026, with fertilizer shortages, oil above $100, healthcare cost acceleration, and the ACA subsidy cliff creating cost feedback loops, it may be dangerously optimistic for early retirees whose spending is concentrated in the categories inflating fastest.
Model it. Stress-test it. Know your number at 3%, at 5%, and at 7%. The gap between those numbers is your margin of safety — or lack of it.
QuantCalc's Monte Carlo retirement planner runs 10,000 market scenarios using forward-looking forecast data from CME, BlackRock, JPMorgan, Vanguard, GMO, Schwab, and Invesco. The ACA Cliff Calculator models subsidy loss under different income scenarios. Both tools are free to use.
Related reading:
- Healthcare Costs in Early Retirement: Why $380K May Not Be Enough
- ACA Subsidy Cliff 2026: Why There's No Cap Above 400% FPL
- Coast FIRE in 2026: Can You Really Stop Saving?
- Best FIRE Calculator 2026: 7 Tools Compared