How to Project Your Dividend Income (10-Year Forecast)
You know how much dividend income you're getting today. But what about in 10 years?
Projecting future dividend income isn't just nice to know—it's essential for planning early retirement, replacing your salary, or hitting a passive income goal.
Here's how to do it properly.
The Simple Projection (And Why It's Not Enough)
Run your own numbers — FREE
10,000 Monte Carlo simulations. Forward-looking forecasts from BlackRock, JPMorgan, Vanguard, GMO, Schwab, Invesco. No account needed.
Try QuantCalc Free →The basic formula is straightforward:
Future Income = Current Income x (1 + Growth Rate)^Years
If you're earning $5,000/year in dividends with 7% annual growth:
- Year 5: $5,000 x 1.07^5 = $7,013
- Year 10: $5,000 x 1.07^10 = $9,836
Simple. But this assumes:
- Growth rate stays constant
- You're not adding new money
- You're not reinvesting dividends
- Nothing goes wrong
Real life is messier.
A Better Model: Three Factors
To project dividend income accurately, you need to account for:
1. Dividend Growth Rate
Different companies grow dividends at different rates. Coca-Cola might grow at 3%, while Broadcom grows at 15%.
Your portfolio's growth rate is a weighted average:
Portfolio Growth Rate = Sum(Stock's Income x Stock's Growth Rate) / Total Income
Where to find growth rates:
- Look up 5-year dividend growth rate on Seeking Alpha or Simply Safe Dividends
- Use conservative estimates (5-7% for diversified portfolios)
2. New Contributions
If you're adding $500/month to your dividend portfolio, that compounds significantly over 10 years.
$500/month x 12 months x 10 years = $60,000 in contributions
At 4% yield, that's $2,400/year in additional income—before any growth.
3. Dividend Reinvestment (DRIP)
Reinvesting dividends accelerates compounding. Your $5,000 in annual dividends buys more shares, which pay more dividends, which buy more shares.
With DRIP, the formula becomes recursive—each year's income adds to the base for next year.
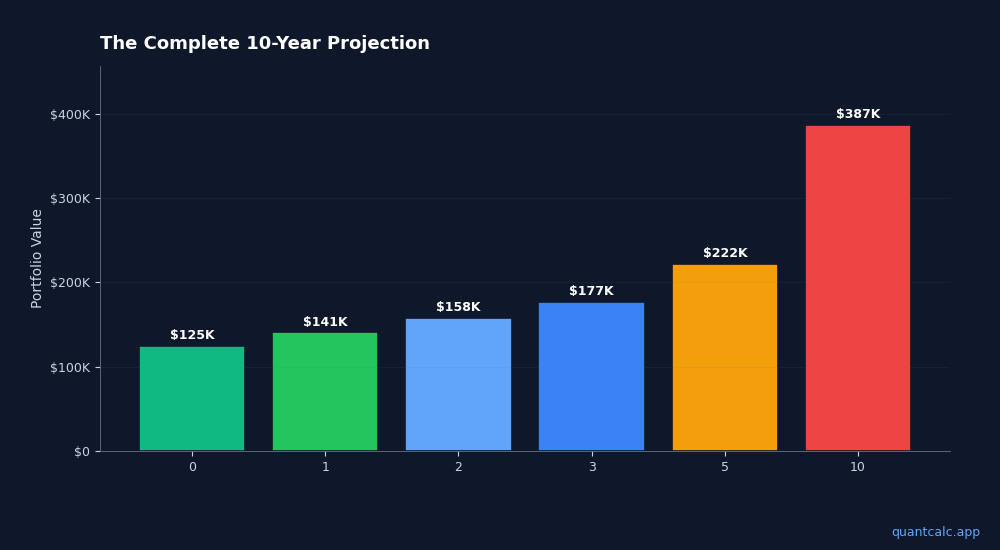
The Complete 10-Year Projection
Here's what a proper projection looks like:
Starting portfolio: $125,000
Current yield: 4.0% ($5,000/year)
Dividend growth rate: 6%
Monthly contribution: $500
DRIP: Yes
Price appreciation: 4%/year
| Year | Portfolio Value | Annual Income | Yield on Cost |
|---|---|---|---|
| 0 | $125,000 | $5,000 | 4.0% |
| 1 | $140,800 | $5,632 | 4.2% |
| 2 | $158,221 | $6,329 | 4.5% |
| 3 | $177,394 | $7,096 | 4.8% |
| 5 | $221,982 | $8,879 | 5.3% |
| 10 | $387,221 | $15,489 | 7.1% |
In 10 years: portfolio tripled, income tripled, yield on cost nearly doubled.
That's the power of dividend growth + contributions + reinvestment.
Adding Uncertainty: Monte Carlo for Dividends
The projection above assumes everything goes according to plan. But what if:
- A company cuts its dividend?
- Growth rates slow down?
- A recession hits early in your timeline?
Monte Carlo simulation adds uncertainty to the model. Instead of one projection, you get a range:
| Percentile | Year 10 Income |
|---|---|
| 5th (bad luck) | $9,200 |
| 25th | $12,100 |
| 50th (median) | $15,489 |
| 75th | $19,800 |
| 95th (good luck) | $27,300 |
Now you know: even in a bad scenario, you're likely to at least double your income. In a good scenario, you might 5x it.
Key Takeaways
- Simple projections (current income x growth) underestimate by ignoring contributions and DRIP
- Your yield on cost will rise over time—that's the point of dividend growth investing
- Add uncertainty ranges to avoid overconfidence in a single number — your retirement spending strategy should account for this variability
- Track per-stock growth rates, not just portfolio average
Start with your current income. Project it forward. Then stress-test it.
Project Your Portfolio Forward
Use Monte Carlo simulation to see the range of possible outcomes for your retirement income, not just a single optimistic projection.