What is the safe withdrawal rate by retirement year (cohort)?
3.69% – 10.64% There is no single safe rate — it depends on the year you retire. Across 123 historical 60/40 cohorts (retirement years 1871–1993), the highest inflation-adjusted withdrawal rate that lasted a full 30 years ranged from 3.69% for the 1966 cohort to 10.64% for the 1982 cohort, with a median of 6.15%. A constant 4% withdrawal lasted 30 years in 95.9% of cohorts, 4.5% in 89% and 5% in 75%. These are historical outcomes computed from the Shiller dataset snapshot (http://www.econ.yale.edu/~shiller/data/ie_data.xls) retrieved 2026-07-21, not a forecast — see Result 1 (cohort by cohort) and Result 2 (survival by rate and allocation).
Key numbers — each row links to the section with the full table. Page updated 2026-10-12; data unchanged since v2026.1.
| Key number | Value | Where on this page |
|---|---|---|
| Lowest cohort safe withdrawal rate (60/40, 30 years) | 3.69% (1966 retirement year) | Result 1 |
| Highest cohort safe withdrawal rate (60/40) | 10.64% (1982 retirement year) | Result 2 |
| Median cohort safe withdrawal rate (60/40) | 6.15% | Result 2 |
| Cohorts that lasted 30 years at 4% / 4.5% / 5% (60/40) | 96% / 89% / 75% | Result 2 |
| Cohorts analysed (data snapshot retrieved 2026-07-21) | 123 (1871–1993) | Methodology |
| Same question in the QuantCalc planner’s historical engine (819 start months from August 1926, realized CPI): lasted at 4% (60/40) | 97.3% | Cross-check |
Run this scenario in the planner →
Opens the calculator prefilled with the headline scenario — a 60/40 portfolio, a 4% inflation-adjusted withdrawal, over 30 years — so you can swap in your own numbers against both historical and forward-looking return models.
The question
The 4% rule is a single number, but retirement outcomes are not. The year you retire locks in the exact sequence of returns and inflation you live through, and that sequence — not just the long-run average — decides whether a plan lasts. So we asked the empirical question directly: across every retirement start year in the historical record, what was the highest inflation-adjusted withdrawal rate that a 30-year retirement could actually have sustained?
The data
Every figure on this page is computed from Robert J. Shiller, "Irrational Exuberance" long-horizon dataset (ie_data.xls, Data sheet), retrieved 2026-07-21 from econ.yale.edu and held as a frozen annual snapshot, so every figure here is reproducible from one fixed vintage of the data. From it we take, for each January: the S&P Composite total return (price plus reinvested dividends), the CPI level (to convert everything to real, inflation-adjusted terms), and the 10-year Treasury (GS10) yield. Bond total returns are a documented construction from those yields — see Methodology — not an actual bond-fund series.
Result 1: the highest safe withdrawal rate, cohort by cohort
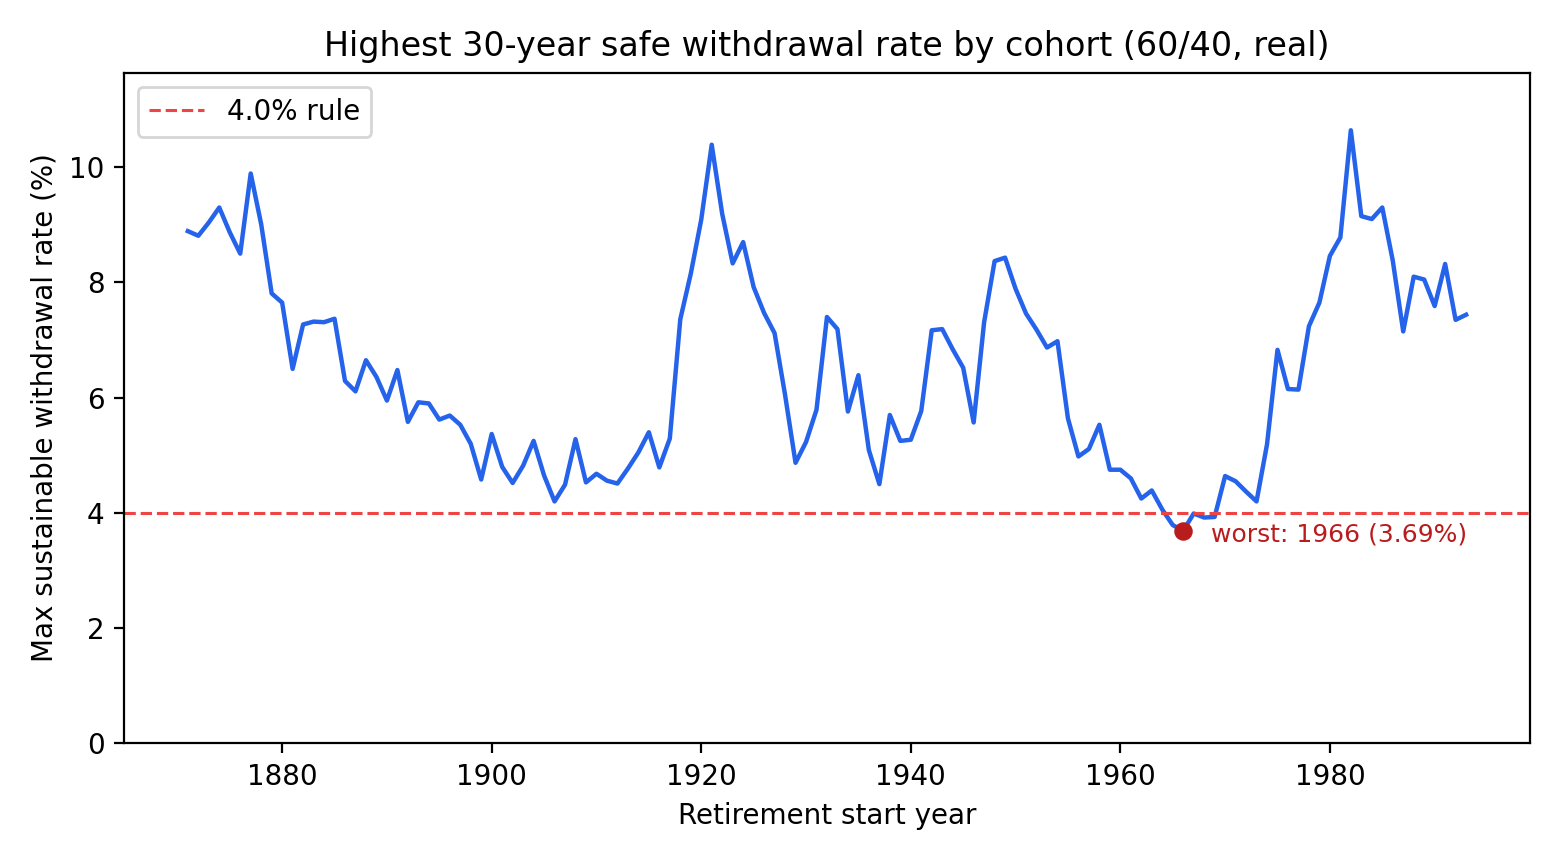
Most cohorts could have sustained far more than 4%; the median was 6.15%. But a cluster of start years in the mid-to-late 1960s sits well below the rest. The single hardest was 1966, whose portfolio could support only 3.69% for 30 years. The ten most demanding cohorts:
| Retirement start year | Max 30-yr rate (60/40) | Lasted at 4.0% | at 4.5% | at 5.0% |
|---|---|---|---|---|
| 1966 | 3.69% | no | no | no |
| 1965 | 3.79% | no | no | no |
| 1968 | 3.92% | no | no | no |
| 1969 | 3.93% | no | no | no |
| 1967 | 3.99% | no | no | no |
| 1964 | 4.06% | yes | no | no |
| 1973 | 4.20% | yes | no | no |
| 1906 | 4.20% | yes | no | no |
| 1962 | 4.25% | yes | no | no |
| 1972 | 4.37% | yes | no | no |
Result 2: survival by withdrawal rate and allocation
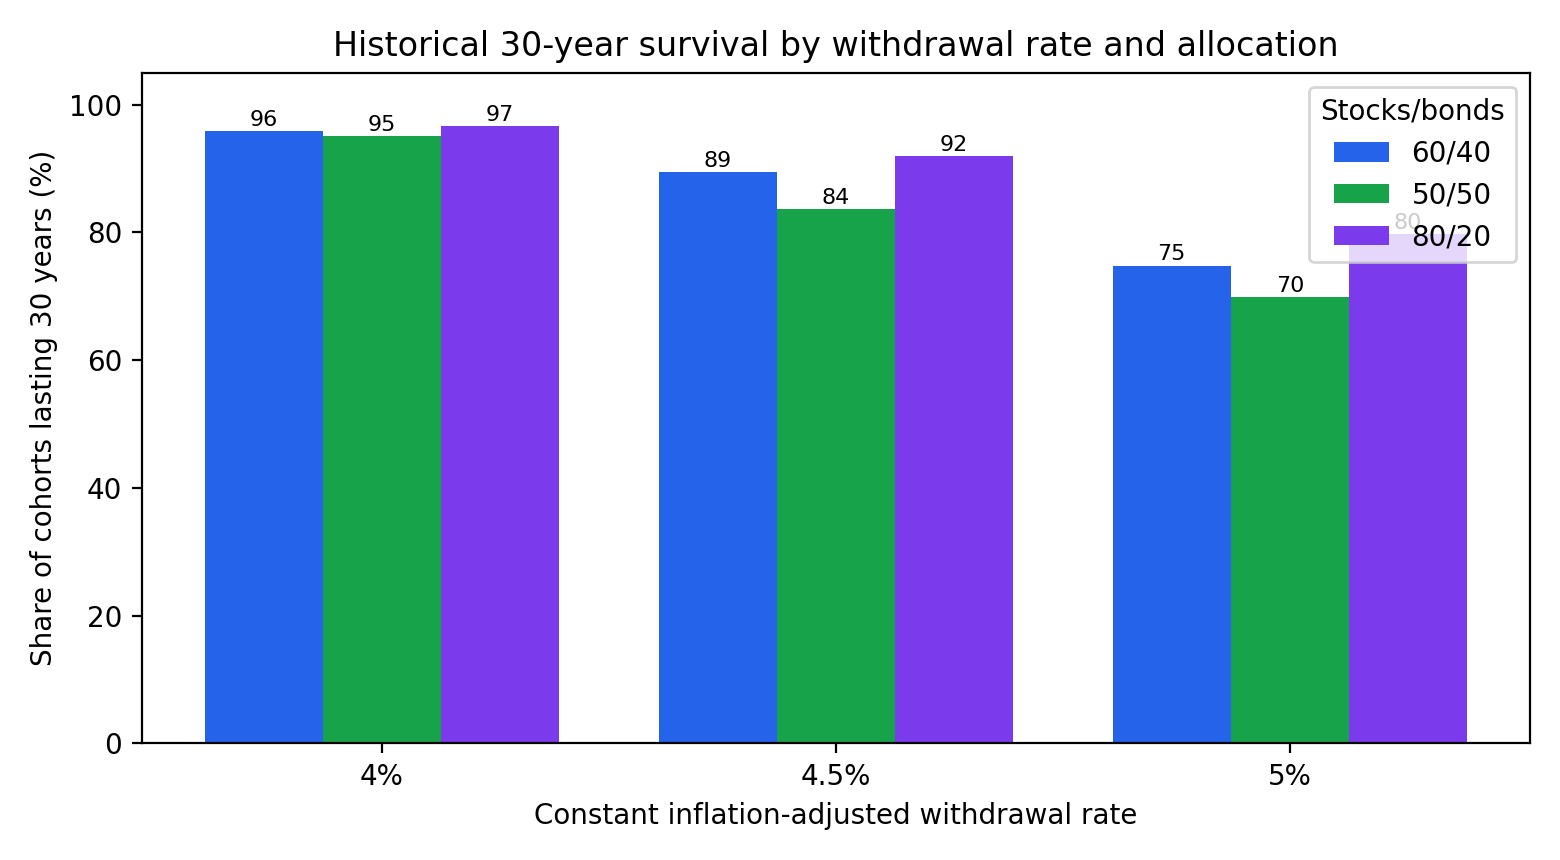
Raising the withdrawal rate steadily lowers the share of cohorts that lasted the full 30 years. A higher equity weight raised both the median and the survival share, at the cost of a wider spread:
| Allocation | Worst cohort | Worst max rate | Median max rate | Best max rate | Lasted at 4% | at 4.5% | at 5% |
|---|---|---|---|---|---|---|---|
| 60/40 (headline) | 1966 | 3.69% | 6.15% | 10.64% | 96% | 89% | 75% |
| 50/50 | 1966 | 3.63% | 5.93% | 10.34% | 95% | 84% | 70% |
| 80/20 | 1966 | 3.77% | 6.59% | 11.23% | 97% | 92% | 80% |
Cross-check: the same question in the QuantCalc planner
The planner answers this question with its own engine: its Historical Sequences mode replays every real 30-year start month in its August 1926 to September 2024 monthly panel (819 start months, August 1926 through October 1994). We ran the same three portfolios through it, with $1,000,000 and a withdrawal raised each month with the inflation that actually happened (the monthly BLS CPI-U, which the planner’s historical mode replays with each sequence), and set the result beside the Shiller cohorts — both for every cohort and for the 68 start years the two records share.
| Allocation | Source | Lasted at 4% | at 4.5% | at 5% | Worst max rate | Median max rate |
|---|---|---|---|---|---|---|
| 60/40 | Shiller, all 123 cohorts (1871–1993) | 95.9% | 89.4% | 74.8% | 3.69% (1966) | 6.15% |
| Shiller, 68 cohorts 1926–1993 | 92.6% | 83.8% | 73.5% | 3.69% | 6.27% | |
| Planner engine, 819 start months | 97.3% | 88.2% | 77.5% | 3.80% (December 1968) | 6.53% | |
| 50/50 | Shiller, all 123 cohorts (1871–1993) | 95.1% | 83.7% | 69.9% | 3.63% (1966) | 5.93% |
| Shiller, 68 cohorts 1926–1993 | 91.2% | 80.9% | 69.1% | 3.63% | 5.91% | |
| Planner engine, 819 start months | 95.2% | 85.8% | 70.5% | 3.82% (December 1968) | 5.99% | |
| 80/20 | Shiller, all 123 cohorts (1871–1993) | 96.7% | 91.9% | 79.7% | 3.77% (1966) | 6.59% |
| Shiller, 68 cohorts 1926–1993 | 94.1% | 86.8% | 77.9% | 3.77% | 7.10% | |
| Planner engine, 819 start months | 98.3% | 90.6% | 81.1% | 3.63% (September 1929) | 7.45% |
- Inflation. Both use the inflation that actually happened: the cohorts divide each year’s return by January-to-January CPI, the planner raises the withdrawal every month with the monthly BLS CPI-U (the same index as the CPI in Shiller’s data). The planner’s hardest start is December 1968; the hardest cohort in Shiller’s data is 1966.
- Data. Shiller’s January-to-January S&P Composite total return against the planner’s monthly US market return from the Ken French Data Library; both build the bond return from the 10-year yield in Shiller’s data.
- Timing. The cohorts withdraw once, at the start of each year, and rebalance yearly; the planner withdraws and rebalances monthly.
- Window. The planner’s panel starts in 1926, so it has no cohorts from 1871–1925, and its 819 start months overlap heavily: they are a few independent histories, not 819 draws.
returnModel: "historical"); the maximum rates are found by bisection on a replay of that model, which was checked against the engine (survival rates, percentiles and sample paths) before publication. Data: engine-crosscheck.json.Test the 60/40 4% plan yourself →
What it implies for retirees
- 4% was conservative in most of history, but not all of it. It lasted in 95.9% of cohorts — the shortfalls clustered in a single difficult era, not scattered randomly.
- Sequence, not average, is the risk. The worst cohorts were defined by weak real returns and high inflation in the FIRST decade of retirement.
- Allocation shifts the whole distribution. More equity lifted the median and the survival share here, but the safe rate is really about surviving the worst sequence, not the average one.
Test a withdrawal plan against these histories
Run your own allocation, horizon, and spending against both the historical record and forward-looking return models in the full planner — and see where your plan lands relative to these cohorts.
Open the planner →Methodology
Source. Robert J. Shiller, "Irrational Exuberance" long-horizon dataset (ie_data.xls, Data sheet), retrieved 2026-07-21 from
http://www.econ.yale.edu/~shiller/data/ie_data.xls, frozen as the committed annual snapshot
research/data/shiller-annual-2026-07.csv. The snapshot is January-anchored: for each year we take
the S&P Composite total return from that January to the next (dividends reinvested monthly), the January CPI
level, and the January GS10 yield.
Cohorts. For every retirement start year with a full 30-year window in the snapshot (1871–1993, 123 cohorts), we walk a rebalanced portfolio and take a constant inflation-adjusted withdrawal at the start of each year. All returns are real: each year's nominal return is divided by that year's realized CPI inflation. A cohort "survives" a given rate if the balance is never driven negative across the 30 annual withdrawals; the maximum sustainable rate is found by bisection to two decimal places.
Bond returns are a construction, not a fund. The snapshot stores GS10 yields. We build an annual 10-year Treasury total return using the standard constant-maturity par-bond approximation: hold a par bond with coupon equal to the starting yield, revalue its nine remaining years at next year's yield, and add the coupon — the standard approach in the withdrawal-rate literature. This is a documented construction from yields and is not presented as actual bond-fund performance.
These are historical outcomes, not forecasts. The study describes what portfolios started in each past year would have experienced. It makes no claim about future returns; for a forward-looking view see the capital-market-expectations stress test. See our methodology for assumptions shared across QuantCalc research.
Reproducibility
Full per-cohort results are published as open data under a CC0 public-domain dedication: results.csv and summary.json. The computation is deterministic and reproduces from the committed snapshot with no network access. Source: Robert J. Shiller, "Irrational Exuberance" long-horizon dataset (ie_data.xls, Data sheet) (econ.yale.edu, retrieved 2026-07-21).
Changelog
- 2026-10-12 — added the cross-check against the QuantCalc planner’s historical engine, with the reasons the two records differ. No Shiller figure, results.csv or summary.json changed; the dataset remains v2026.1.
- 2026-09-06 — answer-first summary added at the top of the page (the question, a direct answer, a key-numbers table and matching FAQ structured data), all templated from the same computed values. No figure, results.csv or summary.json changed; the dataset remains v2026.1.
- v2026.1 — initial release (2026-07-21). 123 cohorts (1871–1993), 60/40 headline plus 50/50 and 80/20, from the 2026-07-21 Shiller snapshot.
FAQ
What is the safe withdrawal rate by retirement year (cohort)?
There is no single safe rate — it depends on the year you retire. Across 123 historical 60/40 cohorts (retirement years 1871–1993), the highest inflation-adjusted withdrawal rate that lasted a full 30 years ranged from 3.69% for the 1966 cohort to 10.64% for the 1982 cohort, with a median of 6.15%. A constant 4% withdrawal lasted 30 years in 95.9% of cohorts, 4.5% in 89% and 5% in 75%. These are historical outcomes computed from the Shiller dataset snapshot (http://www.econ.yale.edu/~shiller/data/ie_data.xls) retrieved 2026-07-21, not a forecast — see Result 1 (cohort by cohort) and Result 2 (survival by rate and allocation).
What is a retirement cohort, and why analyze by start year?
A cohort is everyone who retires in the same year and therefore lives through the same sequence of market returns and inflation. Because the ORDER of returns matters as much as the average, two retirees with identical long-run averages can have very different outcomes depending on when they started. Rolling the same 30-year rule across every historical start year is the classic way to see that spread.
Which cohort was the hardest, and why?
In this data the 1966 start year was the most demanding for a 60/40 portfolio: its highest sustainable withdrawal rate was only 3.69%. Retirees who started in the mid-to-late 1960s met a long stretch of high inflation and weak real stock returns early in retirement — the sequence-of-returns pattern that does the most damage, because withdrawals compound against a portfolio that has not yet grown.
Did the 4% rule hold up historically?
For a 60/40 portfolio, a constant 4% inflation-adjusted withdrawal lasted the full 30 years in 95.9% of the 123 cohorts. It fell short in the remaining 4.1% — a small set clustered around the mid-1960s start years. The median cohort could have withdrawn far more: about 6.15% a year.
How is this different from the forward-looking 4% study?
This page is history: what actually happened to portfolios started in each year since 1871. Our companion study, the forward-looking capital-market-expectations stress test, instead asks whether 4% survives six published forecasts of FUTURE returns. History tells you the range that has already occurred; the forecast study tells you what today's return expectations imply. They answer different questions and are best read together.
Can I test my own numbers?
Yes. The full planner lets you run your own allocation, horizon, and spending against both historical and forward-looking return models, so you can see where your plan sits relative to these cohorts.
Published 2026-07-21, updated 2026-10-12 by QuantCalc Research. Educational research, not financial advice. Related: the 4% rule vs. forward-looking forecasts · withdrawal strategy success rates (guardrails vs. the fixed 4% rule).
Cite this research study
QuantCalc Research (2026). The 4% rule across 123 historical retirement cohorts (1871-1993). https://quantcalc.app/research/safe-withdrawal-by-retirement-cohort-2026/ (accessed <date>).
BibTeX
@misc{quantcalc2026the4ruleacross123historicalretirementcoh,
  title  = {The 4% rule across 123 historical retirement cohorts (1871-1993)},
  author = {{QuantCalc Research}},
  year   = {2026},
  url    = {https://quantcalc.app/research/safe-withdrawal-by-retirement-cohort-2026/},
  note   = {Accessed <date>}
}
Machine-readable citation metadata (schema.org identifier and citation fields) is embedded in this page's JSON-LD, at the stable identifier https://quantcalc.app/research/safe-withdrawal-by-retirement-cohort-2026/.