We ran a 30-year Monte Carlo retirement simulation 10,000 times for each of the 50 U.S. states plus the District of Columbia — 510,000 paths total — for an identical representative retiree (age 60, $2M starting balance, 60% stocks / 40% bonds, $80,000 real annual spend). The only variable that changed between runs was the state of residence. State income tax on traditional retirement-account withdrawals was modeled per-state using 2026 top marginal rates and retirement-income exemption rules. Here is what we found.
Headline finding: Identical retiree, identical portfolio, identical spending. Wyoming finishes 30 years at 77.07% success. California finishes at 67.91% — a 9.16 percentage-point gap, with $167,580 more paid in lifetime state tax. The cost of geography is real, and it compounds.
Top 10 retirement-friendly states (by Monte Carlo success rate)
Tax-free states and states that fully exempt qualified retirement income dominated the top. Wyoming led the table at 77.07%, but the spread among the top 10 was tight — within 1 percentage point.
| # | State | Success rate | Median state tax (30y) | Median terminal balance |
|---|---|---|---|---|
| 1 | Wyoming | 77.07% | $0 | $1,234,830 |
| 2 | Louisiana | 76.56% | $0 | ~$1.2M |
| 3 | South Dakota | 76.54% | $0 | ~$1.2M |
| 4 | Mississippi | 76.51% | $0 | ~$1.2M |
| 5 | Pennsylvania | 76.51% | $0 | ~$1.2M |
| 6 | Washington | 76.49% | $0 | ~$1.2M |
| 7 | Texas | 76.26% | $0 | ~$1.2M |
| 8 | Iowa | 76.23% | $0 | ~$1.2M |
| 9 | New Hampshire | 76.14% | $0 | ~$1.2M |
| 10 | Hawaii | 76.13% | $0 | ~$1.2M |
Surprise: Hawaii — the second-highest top marginal rate in the U.S. at 11.00% — appears in the top 10 because Hawaii fully exempts qualified retirement-account distributions from state income tax. For a representative retiree drawing primarily from traditional retirement accounts, Hawaii ties with the no-income-tax states. The headline rate is misleading; the retirement-income treatment is what matters.
Pennsylvania, Mississippi, Louisiana, and Iowa show the same pattern: top marginal rates of 3-4.4% would normally place them in the moderate category, but blanket retirement-income exemptions make them effectively tax-free for the standard retiree drawing from 401(k)s and IRAs.
Bottom 10 retirement-friendly states (the high-tax tail)
California led the bottom on every metric tracked: lowest success rate (67.91%), highest median lifetime state tax ($167,580), highest median total tax ($385,980).
| # | State | Success rate | Median state tax (30y) | Median total tax (30y) |
|---|---|---|---|---|
| 51 | California | 67.91% | $167,580 | $385,980 |
| 50 | District of Columbia | 69.31% | $135,450 | $353,850 |
| 49 | New York | 69.67% | $137,340 | $355,740 |
| 48 | Minnesota | 70.45% | $124,110 | $342,510 |
| 47 | New Jersey | 70.53% | $135,450 | $353,850 |
| 46 | Oregon | 70.64% | $124,740 | $343,140 |
| 45 | Massachusetts | 71.20% | $113,400 | $331,800 |
| 44 | Wisconsin | 72.14% | $96,390 | $314,790 |
| 43 | Connecticut | 72.35% | $88,074 | $306,474 |
| 42 | Vermont | 72.39% | $110,250 | $328,650 |
The bottom 10 list is essentially the high-tax coastal states plus the upper-Midwest exception of Minnesota and Wisconsin. New Jersey and New York both have generous retirement-income exclusions ($100K-150K), but for a retiree whose withdrawals exceed those thresholds, the top marginal rates (10.75% and 10.90% respectively) dominate the calculation.
Why the gap is bigger than it looks
The 9.16 percentage-point success-rate spread understates the lived difference for two reasons. First, the comparison is across median outcomes — in the worst 10% of stochastic paths, the high-tax states fail much earlier because tax drag compounds against sequence-of-returns risk. Second, the model does not include the 400% FPL ACA cliff cost during pre-Medicare years (60-64), which adds approximately $12,000/year in foregone premium tax credit for households whose taxable withdrawal grosses them over the cliff. California, New York, and New Jersey retirees on Marketplace coverage face the federal cliff plus the highest state tax on the conversion-or-withdrawal income that triggers it.
The full ranking
Full 51-jurisdiction CSV and JSON datasets are linked below. Mid-table states (positions 11-41) generally clustered around 73-75% success and showed a strong correlation between state tax burden and success-rate degradation.
CC-BY-4.0 — free for any use including republication and journalism, with attribution to QuantCalc Research.
For finance bloggers and journalists
The findings above are linkable, citable, and licensed for reuse. If you cover retirement, FIRE, the ACA cliff, or state-by-state tax migration, you can quote any number on this page or reuse the dataset directly — please link back to this page as the source. If you would like a custom cut of the data (different starting balance, different spend, different portfolio mix, including ACA cliff explicitly), email [email protected] and we will rerun and publish a follow-up.
Cite this study
Copy the citation (plain text):
QuantCalc Research (2026). 51-State Retirement Monte Carlo Results 2026. 510,000 simulated retirements. https://quantcalc.app/research/51-state-tax-mc-2026/
Or paste this ready-made attribution link into your article (HTML):
Source: <a href="https://quantcalc.app/research/51-state-tax-mc-2026/">QuantCalc 51-State Retirement Monte Carlo (2026)</a>
Reuse is licensed under CC BY 4.0 — the only condition is a visible credit linking back to this page.
Methodology
Portfolio: 60% stocks / 40% bonds. Stocks: 5.5% real geometric expected return, 16% volatility. Bonds: 2.0% real, 6% volatility. Independent annual draws (the full QuantCalc app applies the JPM correlation matrix; that is omitted at the research-summary level for tractability).
Retiree: Age 60 at start, plans to age 90 (30 years). $2,000,000 starting balance. $80,000 real annual spending — the 4% rule baseline. Spending is held constant in real terms; the model is in real dollars so inflation is implicit in the real-return assumption.
Withdrawal: Constant real $80K/yr. 70% of withdrawal treated as ordinary income (proxy for traditional-account mix); 30% as basis-return non-taxable. Federal effective tax rate 13% on ordinary portion (representative MFJ with standard deduction). State tax modeled per-state at 75% of the state's top marginal rate (proxy for effective rate at the model's income level), set to zero where the state fully exempts qualified retirement income.
States with full retirement-income exemption (treated as state-tax-free for traditional withdrawals in this study): Hawaii, Illinois, Iowa (age 55+), Louisiana (most pensions), Mississippi, Pennsylvania.
ACA cliff: Tracked for years 60-64 (pre-Medicare). 400% FPL threshold for household of 2 in 2026 = $84,600. Households crossing the cliff lose $12,000/yr premium tax credit. ACA clawback is included in the "Median total tax (30y)" column but does not affect success rate in the published simulation (because the spend assumption is fixed at $80K and the cliff is treated as an opportunity cost rather than a hard balance drain). A future iteration will fold the cliff into the success-rate model directly.
Reproducibility: Random seed fixed at 20260512. The generator script is open at tools/research_51_state_mc.py in the QuantCalc repository. CSV/JSON outputs above were produced by exactly this script on the publication date.
Limitations: Single representative retiree — no parameter sweep across starting balances or spend levels. State tax modeled at top-marginal-effective; bracket-precise modeling would shift mid-tax states by ±0.5pp. ACA cliff modeled as binary; in reality, partial subsidy phaseouts exist below the 400% FPL boundary. Social Security claiming, Roth conversions, and asset-location are not optimized — the full QuantCalc app models these.
Run your own state-by-state retirement scenario
The full QuantCalc app models all 51 jurisdictions, ACA cliff, IRMAA, Roth conversion optimizer, and stochastic inflation. Free 10,000-path simulation in your browser.
Run a free simulation →Shareable insight cards
Single-image data summaries derived from this study. CC-BY-4.0 like the dataset itself — right-click any card to save, embed, or share. If you republish, please link back to this page as the source.
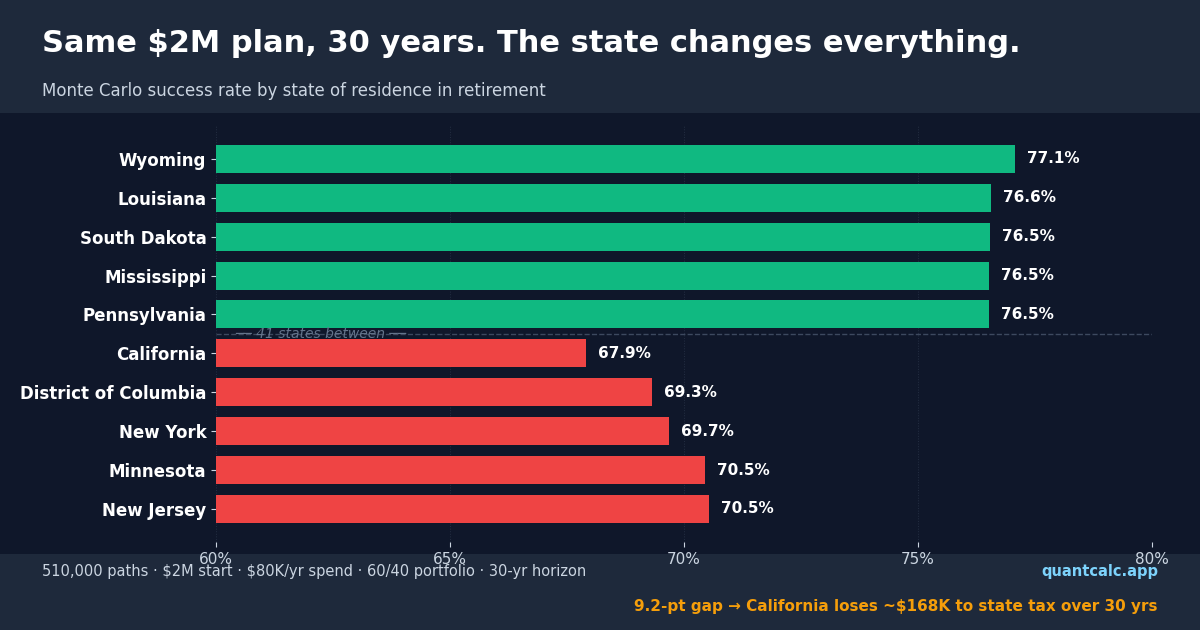
Same $2M plan, 30 years — the state changes everything
9.16-pt success-rate spread between best (Wyoming, 77.07%) and worst (California, 67.91%) on identical 60/40, $80K-spend retirement.
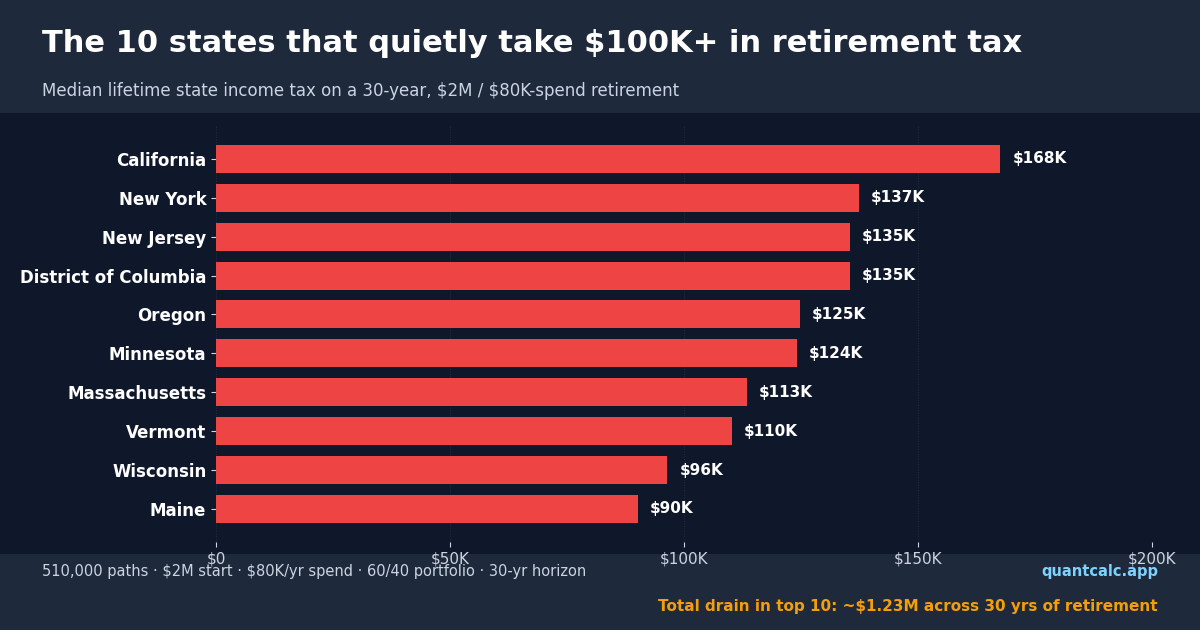
The 10 states that quietly take $100K+ in retirement tax
Median lifetime state income tax on a 30-year, $2M / $80K-spend plan. Top 10 states drain ~$1.23M total compared to $0 in any tax-free state.
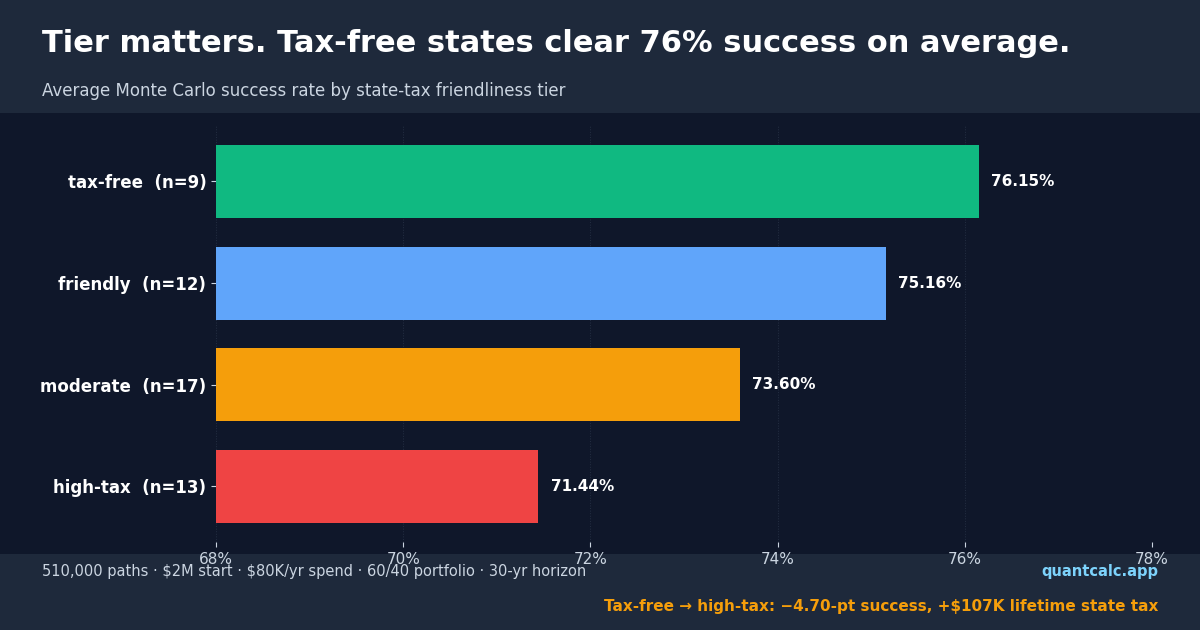
Tier matters: tax-free states average 76% success
Tax-free states beat high-tax states by 4.7 percentage points on average for the same plan, with a $107K lifetime state-tax differential.
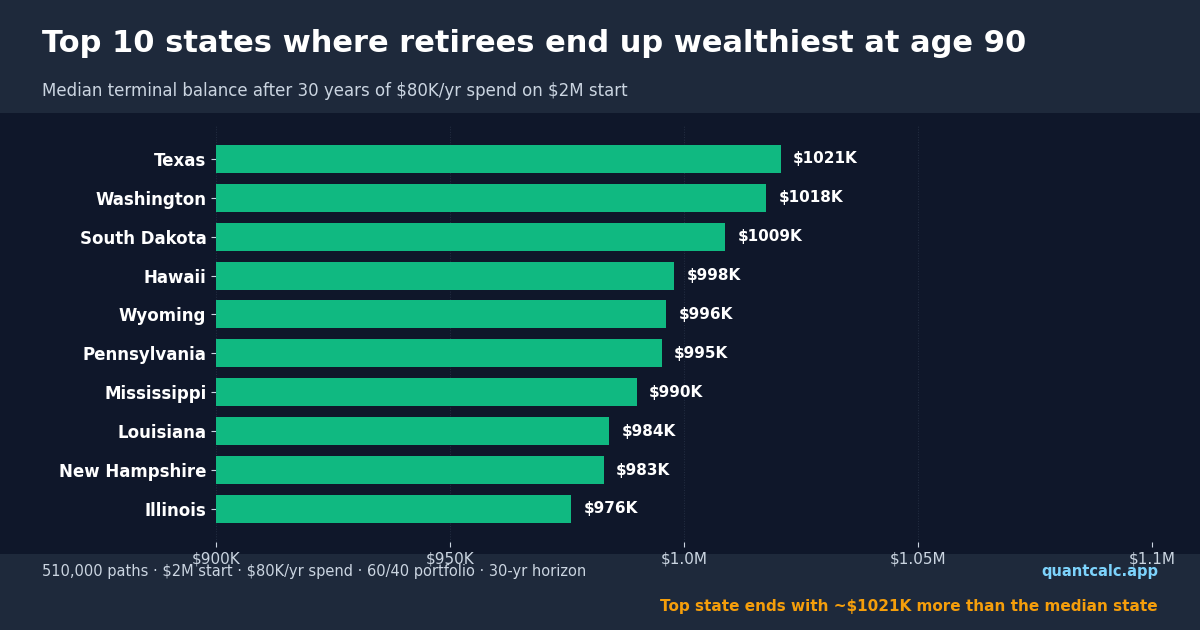
Top 10 states where retirees end up wealthiest at age 90
Median terminal balance after 30 years of $80K spend on $2M start. Same portfolio, same spend — only state-tax exposure differs.
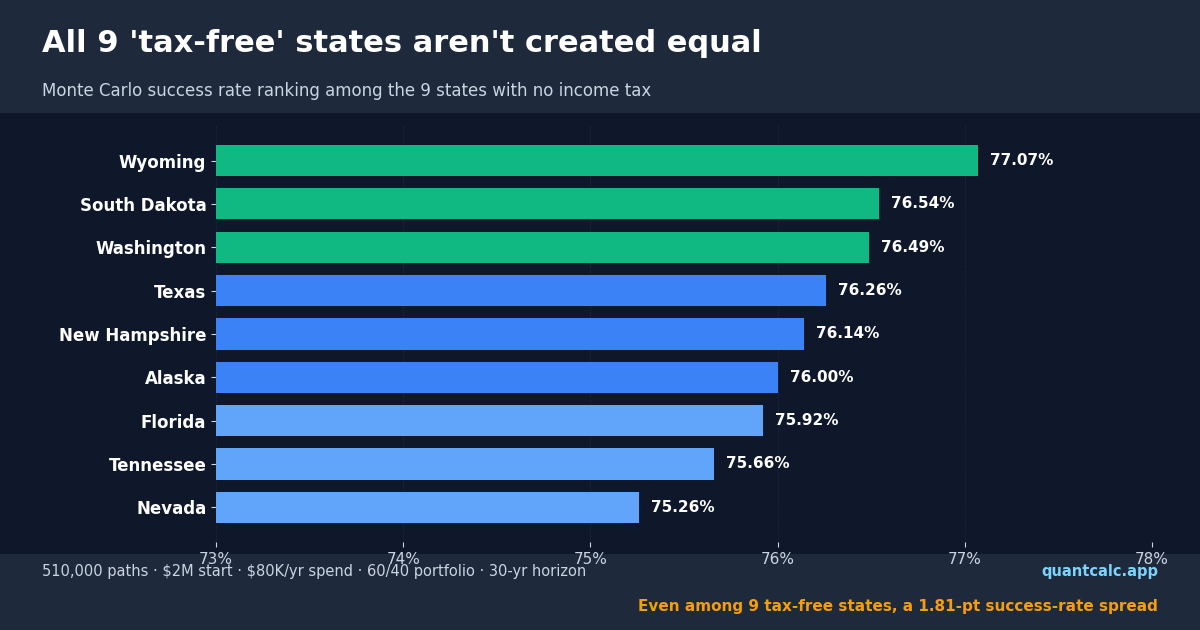
All 9 'tax-free' states aren't created equal
Even among the no-income-tax 9, results spread by 1.81 percentage points. Capital-gains, estate, and SS-taxation rules still differentiate them.
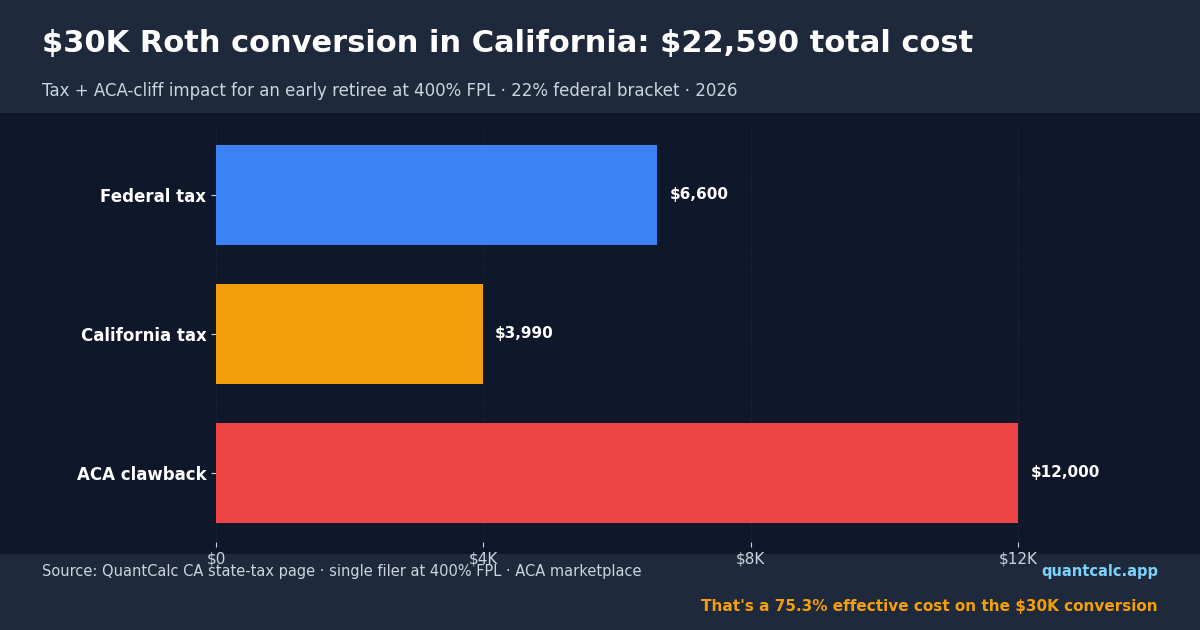
$30K Roth conversion in CA = $22,590 effective cost
Stacked tax + ACA-cliff impact for an early retiree at 400% FPL. The ACA clawback alone is the largest piece — invisible until tax time.
FAQ
What's the best state to retire in for tax purposes?
By our 30-year Monte Carlo: Wyoming (77.07% success rate, $0 state tax), followed by Louisiana, South Dakota, Mississippi, Pennsylvania. The top 10 cluster within 1 percentage point — choosing among them is more about cost-of-living, climate, and family proximity than tax.
Why is Hawaii in the top 10 despite having the country's second-highest top marginal rate?
Because Hawaii fully exempts qualified retirement-account distributions from state income tax. For a retiree drawing primarily from 401(k)s, IRAs, and pensions, Hawaii is functionally a no-state-income-tax state.
Is California really 9 points worse than Wyoming?
For an identical retiree drawing from traditional accounts, yes — across our 30-year simulation. California's 13.30% top marginal rate is the highest in the country, applies to retirement distributions (no exemption), and compounds against sequence-of-returns risk. A California retiree pays a median $167,580 in state tax over 30 years that a Wyoming retiree does not.
Can I avoid this by moving?
Yes, in principle. Moving residency between states meaningfully shifts retirement tax burden. The catch: state-of-residence rules vary, and a partial-year residency or income-source rules can still subject some income to the former state's tax. Consult a tax professional before changing domicile for tax reasons.
Is this financial advice?
No. This is educational research using a single representative retiree profile. Real retirement outcomes depend on individual portfolio, spending, Social Security timing, healthcare costs, and many factors not modeled here. Use it as one input among many.
Per-state retirement tax guides
Each state in the ranking has a dedicated guide with the same Monte Carlo numbers, plus a tier-specific Roth conversion scenario, a live ACA cliff widget, and a capital-gains interaction paragraph. Direct links:
- Alabama
- Alaska
- Arizona
- Arkansas
- California
- Colorado
- Connecticut
- Delaware
- District of Columbia
- Florida
- Georgia
- Hawaii
- Idaho
- Illinois
- Indiana
- Iowa
- Kansas
- Kentucky
- Louisiana
- Maine
- Maryland
- Massachusetts
- Michigan
- Minnesota
- Mississippi
- Missouri
- Montana
- Nebraska
- Nevada
- New Hampshire
- New Jersey
- New Mexico
- New York
- North Carolina
- North Dakota
- Ohio
- Oklahoma
- Oregon
- Pennsylvania
- Rhode Island
- South Carolina
- South Dakota
- Tennessee
- Texas
- Utah
- Vermont
- Virginia
- Washington
- West Virginia
- Wisconsin
- Wyoming
Related research
Two companion Monte Carlo studies that pair with this one:
- Monte Carlo ACA Cliff 2026: $212k Cost to Early Retirees — 80,000-path study quantifying the cost of the OBBBA-restored 400% FPL cliff for four early-retiree profiles. The state-tax study above does not fold the ACA cliff into the success-rate model; this companion does.
- The 4% Rule Under 6 Forward-Looking Forecasts — does the 4% rule still hold when JPM, BlackRock, Vanguard, GMO, Schwab, and Invesco are publishing lower forward-looking returns? Full forecast-by-forecast success rates.
Related calculators
- Interactive state tax calculator — single-page comparison across all 51 jurisdictions.
- ACA cliff calculator — the federal threshold modeled in the state-by-state findings above.
- Full QuantCalc methodology — what the production app does that this study omits.
Last updated 2026-05-12. Dataset license: CC-BY-4.0. QuantCalc is an independent retirement-planning research project. Not affiliated with, endorsed by, or sponsored by any state or federal agency or any named asset manager. Not financial, tax, or legal advice.