How Much Do I Need to Retire? The Math Behind the Number
"How much do I need to retire?" is the most common question in personal finance. The answer most people give — a single dollar amount — is wrong. Not because the math is bad, but because a single number ignores the one thing that determines whether you actually run out of money: uncertainty.
Here's how to calculate your retirement target, and why the simple answer isn't good enough.
The 25x Rule: Your Starting Point
Run your own numbers — FREE
10,000 Monte Carlo simulations. Forward-looking forecasts from BlackRock, JPMorgan, Vanguard, GMO, Schwab, Invesco. No account needed.
Try QuantCalc Free →The most widely used retirement target formula:
Annual expenses x 25 = Retirement savings target
If you spend $60,000 per year, you need $1.5 million. If you spend $100,000, you need $2.5 million.
This comes from the 4% withdrawal rate — the idea that you can withdraw 4% of your portfolio each year and have a high probability of not running out of money over a 30-year retirement. The 25x rule is just 1 divided by 0.04.
The 4% rule originates from William Bengen's 1994 research, later refined by the Trinity Study. It assumed a 50/50 stock/bond portfolio and a 30-year retirement horizon. Under historical U.S. market conditions, a 4% initial withdrawal rate (adjusted for inflation each year) survived roughly 95% of all 30-year periods.
Simple. Intuitive. And dangerously incomplete.
Why a Single Number Fails
The 25x rule assumes:
- You'll live exactly 30 years in retirement
- Inflation will behave like it has historically
- Markets will perform roughly as they have since 1926
- You'll spend the same amount every year (adjusted for inflation)
- You won't face any major unexpected expenses
None of these assumptions will hold precisely. Markets might return 10% for a decade, then crash 40%. Inflation might run at 5% instead of 3% (with oil at $115/barrel as of this writing, that's not hypothetical). You might live to 95 or face a $200,000 medical event at 78.
A single number gives you false confidence. What you actually need is a probability.
Monte Carlo: The Better Answer
Instead of asking "how much do I need?", the right question is: "what's the probability that my savings will last?"
Monte Carlo simulation answers this by running your retirement plan through thousands of randomized market scenarios. Each scenario uses different sequences of returns, drawn from a distribution based on historical or projected market behavior.
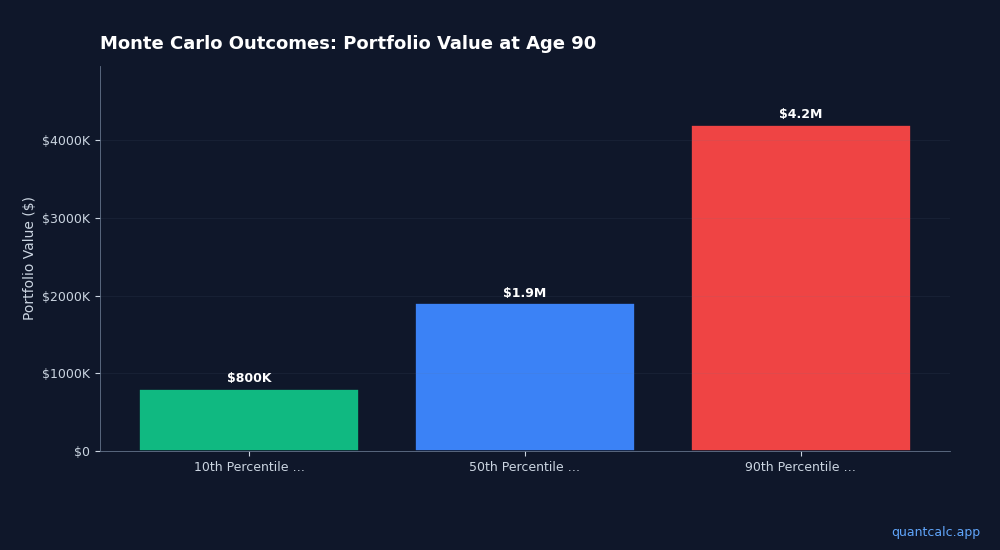
The output isn't a number — it's a range:
- 10th percentile: What happens if markets are terrible (you still have $800K at 90)
- 50th percentile: The median outcome ($1.9M at 90)
- 90th percentile: What happens if markets are great ($4.2M at 90)
- Success rate: 87% of scenarios, you don't run out of money
This tells you far more than "$1.5 million." It tells you the odds. And odds are what you actually need to make decisions.
The Variables That Move Your Number
Your retirement target isn't fixed. Five variables shift it significantly:
1. Withdrawal rate. The 4% rule is a starting point. If you retire at 40 instead of 65, you need your money to last 50+ years — and 4% might be too aggressive. Many early retirees use 3.25-3.5%.
2. Asset allocation. A 100% stock portfolio has higher expected returns but more volatility. A 60/40 mix reduces volatility but may not keep up with inflation over long horizons. Your allocation changes the probability distribution of outcomes.
3. Inflation. At 3% inflation, $60,000 in today's dollars becomes $121,000 in purchasing-power-equivalent spending after 25 years. Your savings need to grow faster than inflation, not just faster than zero.
4. Social Security. If you're eligible for $2,500/month in Social Security at 67, that's $30,000/year of income you don't need to generate from your portfolio. Your savings target drops by $750,000 (30K x 25). Claiming age matters — waiting from 62 to 70 increases your benefit by ~77%.
5. Sequence of returns risk. A 30% market crash in year 1 of retirement is far more damaging than a 30% crash in year 20. Monte Carlo captures this; the 25x rule does not.
How to Run the Numbers
Quick estimate (60 seconds): Use our Retirement Savings Calculator Chrome extension. Enter your age, savings, contributions, and expected return. The free tier shows your projected balance. PRO ($4.99) adds Monte Carlo simulation with probability ranges.
Deep analysis (10 minutes): Use QuantCalc for a full retirement simulation. It runs up to 10,000 Monte Carlo scenarios using forward-looking forecasts from CME, BlackRock, JPMorgan, Vanguard, GMO, Schwab, and Invesco. It also models ACA healthcare subsidies, IRMAA surcharges, and Roth conversion strategies — critical for early retirees.
Compare tools: Our guide to the best free retirement calculators in 2026 explains what features to look for and why most free tools fall short on tax modeling and ACA cliff awareness.
The Real Answer
How much do you need to retire? Somewhere between $800,000 and $4 million, depending on your spending, timeline, risk tolerance, and market conditions.
That's not a cop-out — it's the truth. Anyone who gives you a single number is hiding the uncertainty that will determine whether your retirement succeeds or fails.
Run a Monte Carlo simulation. Know your probability. Plan for the range, not the point estimate.
For a deeper dive into how Monte Carlo simulation works and why it matters, read our guide to Monte Carlo retirement planning.
Frequently Asked Questions
How much money do I need to retire in 2026?
The traditional formula is annual expenses multiplied by 25 (the inverse of the 4% rule). For $60,000/year spending, that is $1.5 million. But this ignores taxes, healthcare costs before Medicare (potentially $15,000-25,000/year for a couple), and the lower return environment projected by major asset managers. A Monte Carlo simulation with your actual spending, tax situation, and Social Security timing gives a far more accurate number.
How do I calculate my retirement number?
Start with your projected annual spending in retirement, including healthcare, taxes, and inflation. Subtract guaranteed income sources (Social Security, pensions). Multiply the remaining gap by 25-33 depending on your risk tolerance and time horizon. Then stress-test with Monte Carlo simulation — a 90%+ success rate across 10,000 scenarios is the standard confidence threshold.
Frequently Asked Questions
The traditional formula is annual expenses multiplied by 25 (the inverse of the 4% rule). For $60,000/year spending, that is $1.5 million. But this ignores taxes, healthcare costs before Medicare (potentially $15,000-25,000/year for a couple), and the lower return environment projected by major asset managers. A Monte Carlo simulation with your actual spending, tax situation, and Social Security timing gives a far more accurate number.
Start with your projected annual spending in retirement, including healthcare, taxes, and inflation. Subtract guaranteed income sources (Social Security, pensions). Multiply the remaining gap by 25-33 depending on your risk tolerance and time horizon. Then stress-test with Monte Carlo simulation — a 90%+ success rate across 10,000 scenarios is the standard confidence threshold.