How does the 2032–33 trust-fund date change the best Social Security claiming age?
Best claiming age: 70 → 68 It moves the best claiming age earlier, or leaves it unchanged — never later. For a worker born 1964 with a $2,000/month benefit at full retirement age (unisex mortality, undiscounted), the 2026 Trustees Report projection (https://www.ssa.gov/oact/trsum/, checked 2026-09-10) — trust-fund reserves depleted in Q4 2032, so 78% of scheduled benefits payable from 2033 — moves the survival-weighted best claiming age from 70 to 68 and stretches the classic 62-vs-70 break-even from age 80 to 82. Across all 18 profiles tested the projection never moved the best age later: with female mortality the undiscounted best age stays 70, while a 2% real discount rate pulls it from 68 to 62. The value surface is flat near the top (under the projection less than 0.5% separates the best three ages), so read every best age as the middle of a range; single worker, federal tax only, published 2026-07-09 — see the profile table, the break-evens and the tax torpedo.
Key numbers — each row links to the section that carries the full table. Updated 2026-09-07; data unchanged (engine ss-claiming-1.1.0).
| Key number | Value | Where on this page |
|---|---|---|
| Best claiming age, base case ($2,000/mo at FRA, unisex, undiscounted): scheduled → projection | 70 → 68 | Profile by profile |
| Break-even age, claim at 70 vs 62: scheduled → projection | 80 → 82 | Break-evens and planning horizons |
| Profiles where the projection moved the best age later | 0 of 18 | Profile by profile |
| Best age under the projection: female mortality, undiscounted / unisex at a 2% real discount (scheduled → projection) | 70 / 68 → 62 | Profile by profile |
| Lifetime value lost to the projection: delaying to 70 vs claiming at 62 (base case) | 22.0% vs 15.1% | Why a future reduction favors claiming earlier |
| Gap between the best and third-best claiming age under the projection (base case) | under 0.5% of lifetime value | Why a future reduction favors claiming earlier |
| Peak effective marginal rate on other income from the tax torpedo ($40,000 other income, claiming at 67 or later) | 22.2% | Adding taxes: the torpedo |
| After-tax best age at $60,000 of other income, base profile (pre-tax answer 68) | 66 | Adding taxes: the torpedo |
The question
The 2026 Social Security Trustees Report (ssa.gov/oact/trsum/, released 2026-06-09, checked 2026-09-10) projects that the Old-Age and Survivors Insurance trust fund reserves will be depleted in Q4 2032. If that happens and Congress does not act, continuing payroll taxes would still cover about 78% of scheduled benefits — roughly a 22% reduction — with 2033 the first full reduced calendar year. Benefits do not stop; they continue at a reduced level, and Congress has historically acted before such deadlines.
That projection lands hardest on one decision: when to claim. A worker born 1964 turned 62 in 2026, so their entire claiming window — ages 62 through 70 — straddles the projected 2033 step-down. The standard advice to delay for the 8%-per-year credit was built for a world where every year of benefits is paid in full. Does it survive a 22% reduction that starts seven years into the window? We computed the survival-weighted lifetime value of every claiming age from 62 to 70, with and without the projected reduction, and then with federal income tax on benefits layered on top.
Why a future reduction favors claiming earlier, not later
The mechanism is timing, not the size of the checks. A 1964-born worker who claims at 62 collects seven full calendar years (2026–2032) before the projected step-down; from 2033 on, their checks fall to 78% of scheduled like everyone else’s. A worker who delays to 70 starts in 2034 — every check they ever receive is already reduced. Under the projection, delaying to 70 therefore costs 22.0% of lifetime value versus scheduled, while claiming at 62 costs only 15.1%. Delaying loses relatively more, which can only tilt the comparison toward earlier claiming: across all profiles in this study, the projection never moved the best age later.
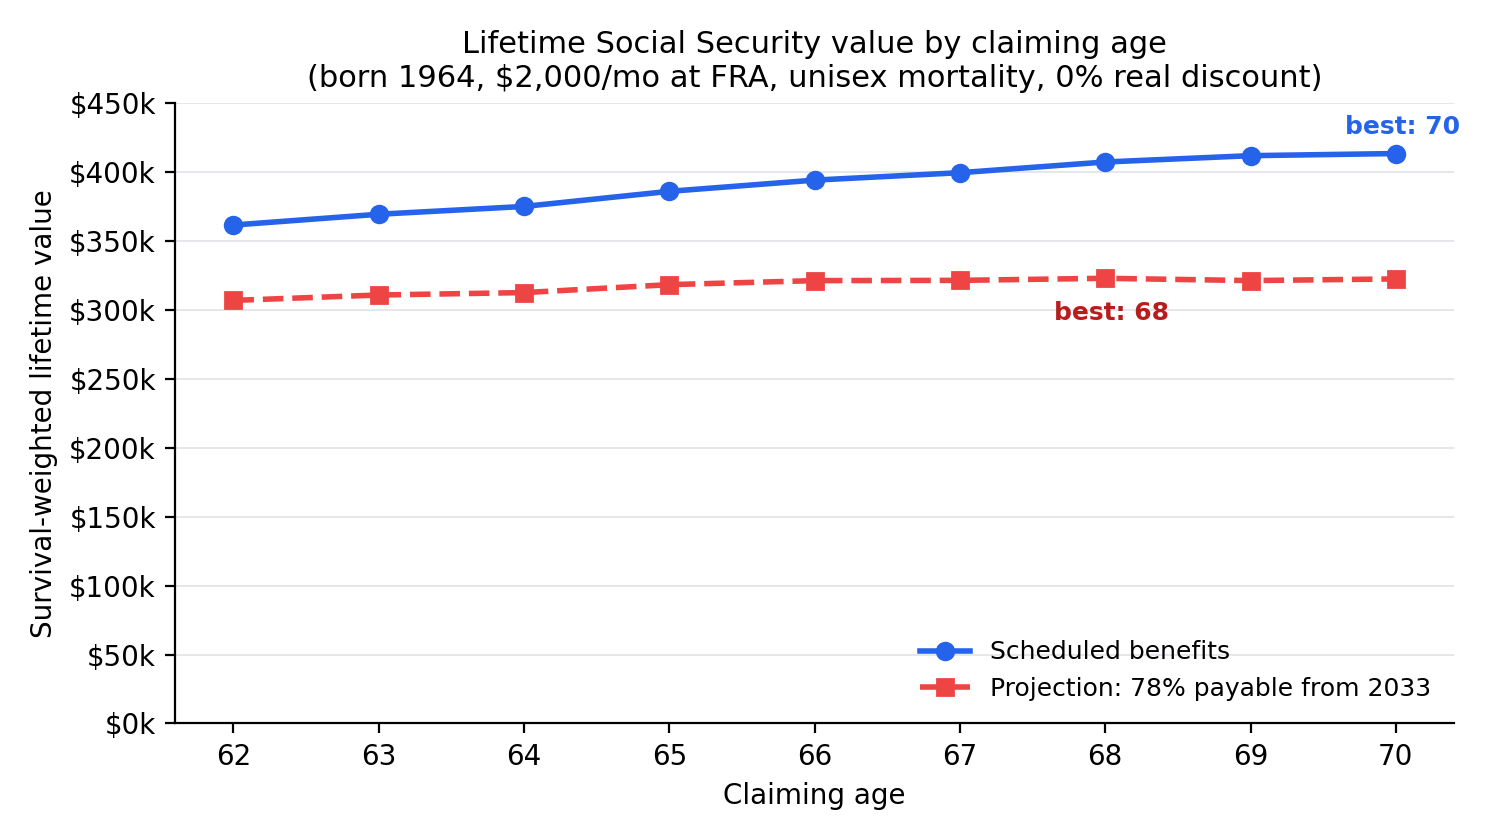
Note how flat both curves are near their peaks: under the projection, the gap between the best and third-best claiming age is under 0.5% of lifetime value (under 1.5% for scheduled benefits). The claiming decision is a range decision, and factors this model holds constant — your health, spousal benefits, portfolio — can legitimately move you within it.
The best claiming age, profile by profile
The size of the shift depends on how you value the future. With no discounting and female mortality the best age stays 70 even under the projection; at a 2% real discount rate (money now worth meaningfully more than money later), the projection pulls the best age all the way from 68 down to 62. The after-tax columns add federal income tax on benefits (single filer, actual 2026 bracket-and-deduction math) at four levels of other retirement income.
| Benefit at FRA | Mortality | Real discount | Best age, scheduled | Best age, projection | Best age, projection + tax ($0 / $20k / $40k / $60k other income) |
|---|---|---|---|---|---|
| $2,000/mo | Male | 0% | 69 | 66 | 66 / 66 / 66 / 66 |
| $2,000/mo | Male | 1% | 69 | 65 | 65 / 63 / 65 / 62 |
| $2,000/mo | Male | 2% | 66 | 62 | 62 / 62 / 62 / 62 |
| $2,000/mo | Female | 0% | 70 | 70 | 70 / 70 / 70 / 70 |
| $2,000/mo | Female | 1% | 70 | 66 | 66 / 66 / 66 / 66 |
| $2,000/mo | Female | 2% | 69 | 65 | 65 / 65 / 65 / 62 |
| $2,000/mo | Unisex (50/50) | 0% | 70 | 68 | 68 / 68 / 68 / 66 |
| $2,000/mo | Unisex (50/50) | 1% | 69 | 66 | 66 / 66 / 66 / 65 |
| $2,000/mo | Unisex (50/50) | 2% | 68 | 62 | 62 / 62 / 62 / 62 |
| $3,200/mo | Male | 0% | 69 | 66 | 66 / 66 / 66 / 66 |
| $3,200/mo | Male | 1% | 69 | 65 | 65 / 63 / 65 / 63 |
| $3,200/mo | Male | 2% | 66 | 62 | 62 / 62 / 62 / 62 |
| $3,200/mo | Female | 0% | 70 | 70 | 70 / 70 / 70 / 70 |
| $3,200/mo | Female | 1% | 70 | 66 | 66 / 66 / 68 / 66 |
| $3,200/mo | Female | 2% | 69 | 65 | 65 / 65 / 66 / 63 |
| $3,200/mo | Unisex (50/50) | 0% | 70 | 68 | 68 / 68 / 70 / 68 |
| $3,200/mo | Unisex (50/50) | 1% | 69 | 66 | 66 / 66 / 66 / 65 |
| $3,200/mo | Unisex (50/50) | 2% | 68 | 62 | 62 / 62 / 65 / 62 |
Break-evens and planning horizons
The classic break-even question — “how long must I live for delaying to pay off?” — shifts by about two to three years under the projection (worker born 1964, $2,000/month at FRA, undiscounted):
| Comparison | Break-even age, scheduled | Break-even age, projection |
|---|---|---|
| Claim at 67 vs 62 | 78 | 81 |
| Claim at 70 vs 67 | 82 | 84 |
| Claim at 70 vs 62 | 80 | 82 |
Another way to see the same shift: if you plan to a specific age instead of weighting by survival odds, the claiming age that maximizes total benefits through that age also moves earlier under the projection:
| Total benefits counted through age… | Best claiming age, scheduled | Best claiming age, projection |
|---|---|---|
| 75 | 62 | 62 |
| 80 | 68 | 65 |
| 85 | 70 | 70 |
| 90 | 70 | 70 |
| 95 | 70 | 70 |
Adding taxes: the torpedo
Federal taxation of benefits uses the IRS Publication 915 provisional-income phase-in, whose thresholds ($25,000 and $34,000 for a single filer) were set in statute in 1983/1993 and are not indexed to inflation. The after-tax mode applies actual 2026-law federal math to each benefit year: the 2026 single-filer brackets and $16,100 standard deduction (IRS Rev. Proc. 2025-32), the $2,050 additional deduction for filers 65 and older, and — for tax years 2025–2028 — the $6,000 senior deduction with its 6% phase-out above $75,000 of income. Two things follow. First, at low incomes benefits are simply untaxed: at $0 of other income the deductions absorb the entire taxable share at every claiming age, and the federal tax attributable to the benefit is zero. Second, inside the phase-in each extra dollar of other income drags 50 or 85 cents of benefits into taxable income — so the statutory 10% and 12% brackets become effective marginal rates of 15% to 22.2% on other income. Larger delayed-claiming checks sit deeper in the phase-in, which is one more reason delaying gives back part of its edge at moderate income levels.
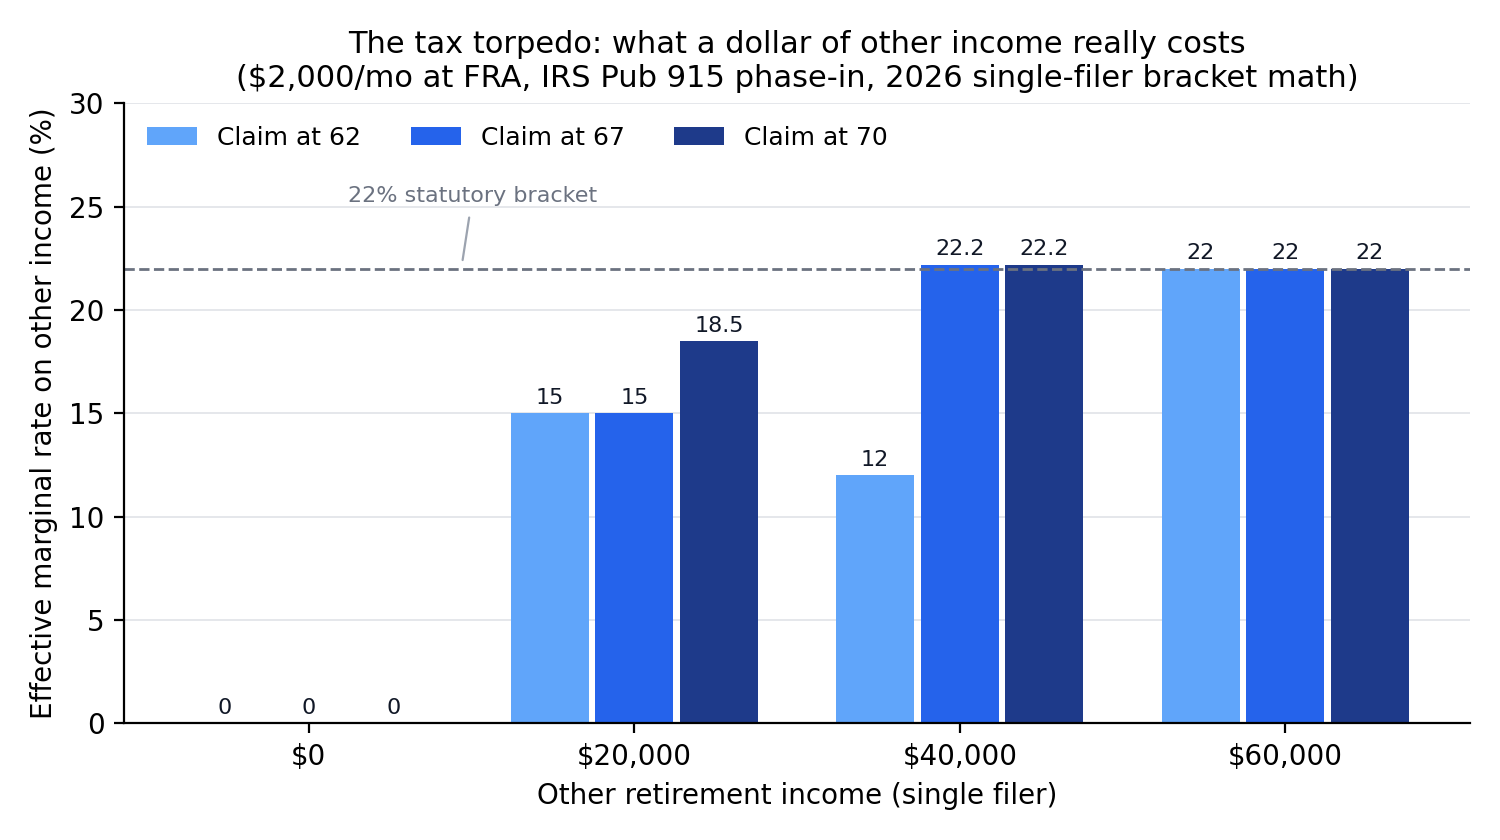
| Other income | Effective marginal, claim at 62 | Claim at 67 | Claim at 70 | Share of benefits taxable (range across 62–70) |
|---|---|---|---|---|
| $0 | 0.0% | 0.0% | 0.0% | 0% |
| $20,000 | 15.0% | 15.0% | 18.5% | 10%–18% |
| $40,000 | 12.0% | 22.2% | 22.2% | 75%–85% |
| $60,000 | 22.0% | 22.0% | 22.0% | 85% |
Two boundary effects are worth naming. At $40,000 of other income, the 85%-of-benefits ceiling already binds for the smaller early-claiming checks — their marginal rate on other income is the plain 12% — while the larger delayed checks are still inside the phase-in at 22.2%. At $60,000 the ceiling binds at every claiming age and the marginal rate reverts to the statutory 22%, but a bracket-level effect appears: the taxable share of a smaller early-claiming check fills more of the remaining 12% bracket before spilling into the 22% one, so early claiming is taxed at a lower average rate — which is why the after-tax best age at $60,000 drops to 66 in the base profile, below the pre-tax answer of 68.
What it implies for your claiming decision
- Delay math weakens, but does not flip to 62 for most profiles. The projection compresses the reward for waiting past full retirement age; it does not make earliest-possible claiming dominant unless you also discount the future heavily or expect shorter-than-average longevity.
- Your longevity assumption matters more than the projection. Female mortality keeps the undiscounted best age at 70 even with the reduction; a 2% real discount rate moves it to 62. Know which of those profiles you resemble before reacting to headlines.
- Check the torpedo before choosing a claiming age. If your other retirement income lands in the $20,000–$40,000 phase-in band, the effective marginal rate on that income can reach 22.2% — the claiming age and the withdrawal plan should be decided together.
Run your own numbers
Free: enter your own benefit, birth year, and assumptions in the Social Security claiming-age calculator — scheduled vs the 2033 projection, side by side. No signup.
Open the claiming-age calculator →Or size the 2033 reduction itself in the 2033 calculator →
Methodology
We compute, for each claiming age 62–70, the survival-weighted present value at age 62 of all benefits through age 100: each year’s benefit is multiplied by the probability of being alive to receive it (SSA 2022 period life table) and discounted at a real rate of 0%, 1%, or 2%. The grid covers two benefit levels ($2,000 and $3,200 per month at full retirement age), three mortality bases (male, female, and a 50/50 unisex blend), and — in the after-tax mode — four levels of other income, for 108 scenarios in total. The engine is deterministic (analytic survival weighting, no sampling; seed 20260709 recorded for future sensitivity runs).
Claiming-age adjustments follow SSA’s published formula for full retirement age 67 (ssa.gov/oact/quickcalc/early_late.html): 5/9 of 1% per month reduction for the first 36 months before FRA, 5/12 of 1% per month beyond, and a delayed retirement credit of 2/3 of 1% per month (8% per year) from FRA to 70:
| Claiming age | 62 | 63 | 64 | 65 | 66 | 67 | 68 | 69 | 70 |
|---|---|---|---|---|---|---|---|---|---|
| Benefit as % of FRA amount | 70% | 75% | 80% | 86.7% | 93.3% | 100% | 108% | 116% | 124% |
Documented assumptions and limitations:
- Reduction timing. The projection is modeled as a one-time permanent step-down to 78% of scheduled starting in calendar 2033, the first full year after the projected Q4 2032 depletion (2026 Trustees Report). Treating the partial quarter in 2032 as unreduced, and ignoring the slight drift in the payable share over later decades, are documented simplifications.
- Real dollars. Benefits are inflation-indexed, so the real benefit is treated as constant and discounting uses real rates. Amounts are annualized; within-year claiming-month detail is ignored.
- Taxes. Federal only, single filer, ordinary income only. Each benefit year is taxed under actual 2026 law: the single-filer brackets and $16,100 standard deduction of IRS Rev. Proc. 2025-32, plus the $2,050 additional standard deduction for filers 65 and older (IRC §63(f)). The tax attributable to the benefit is the difference between tax on other income plus the Publication 915 taxable share and tax on other income alone, computed per year with the same age-to-calendar-year mapping as the reduction model.
- Senior deduction (2025–2028). The 2025 reconciliation act (OBBBA, §70103) adds a $6,000 deduction per filer aged 65 or older for tax years 2025–2028 only, reduced by 6 cents per dollar of income above $75,000 (single filer). The engine models it year-aware; a worker born 1964 turns 65 in 2029, after the window closes, so it never binds in this study’s grid — it does matter through 2028 for older readers using the linked calculator.
- Threshold indexing. All 2026 tax parameters are held constant in real terms. For the brackets and standard deduction that is approximately right (they are CPI-indexed); the Publication 915 thresholds, however, are frozen in nominal terms by statute and shrink in real terms, so the model understates benefit taxation in later years. Because larger delayed checks sit deeper in the phase-in, the understatement is largest for delayed claiming — the residual bias, if anything, flatters delay in the after-tax columns.
- Single worker. Spousal and survivor benefits, the earnings test before FRA, and state income taxes are outside the model. These can dominate the claiming decision for couples — a documented limitation of scope.
- Mortality. SSA 2022 period life table (ssa.gov/oact/STATS/table4c6.html), conditioned on being alive at 62 and truncated at age 100; the unisex basis is a 50/50 blend of the male and female conditional survival curves.
Reproducibility
The full per-scenario results are published as open data under a CC0 public-domain dedication: results.csv (survival-weighted lifetime value for every claiming age in all 108 scenarios) and summary.json (the best-age shifts by profile). The engine (ss-claiming-1.1.0) is deterministic: two runs produce byte-identical output. Sources: SSA claiming-adjustment formula (ssa.gov/oact/quickcalc/early_late.html); 2026 OASDI Trustees Report (ssa.gov/oact/trsum/, released 2026-06-09); SSA 2022 period life table (ssa.gov/oact/STATS/table4c6.html); IRS Publication 915; 2026 brackets and standard deduction per IRS Rev. Proc. 2025-32; senior deduction per OBBBA §70103 (Pub. L. 119-21). See our methodology for the shared assumptions used across QuantCalc research.
FAQ
How does the 2032–33 trust-fund date change the best Social Security claiming age?
It moves the best claiming age earlier, or leaves it unchanged — never later. For a worker born 1964 with a $2,000/month benefit at full retirement age (unisex mortality, undiscounted), the 2026 Trustees Report projection (https://www.ssa.gov/oact/trsum/, checked 2026-09-10) — trust-fund reserves depleted in Q4 2032, so 78% of scheduled benefits payable from 2033 — moves the survival-weighted best claiming age from 70 to 68 and stretches the classic 62-vs-70 break-even from age 80 to 82. Across all 18 profiles tested the projection never moved the best age later: with female mortality the undiscounted best age stays 70, while a 2% real discount rate pulls it from 68 to 62. The value surface is flat near the top (under the projection less than 0.5% separates the best three ages), so read every best age as the middle of a range; single worker, federal tax only, published 2026-07-09 — see the profile table, the break-evens and the tax torpedo.
Does the 2032 depletion projection mean Social Security benefits disappear?
No. The 2026 Social Security Trustees Report (released 2026-06-09, https://www.ssa.gov/oact/trsum/, checked 2026-09-10) projects that the Old-Age and Survivors Insurance trust fund reserves will be depleted in Q4 2032, making 2033 the first full calendar year of reduced benefits. Even then, ongoing payroll taxes would still cover about 78% of scheduled benefits — roughly a 22% reduction, not an end to payments. Congress has historically acted before such deadlines; this study treats the reduction as a planning scenario under current law, not a prediction.
Should everyone claim at 62 if the reduction happens?
No. In this analysis the projection moves the lifetime-value-maximizing claiming age earlier or leaves it unchanged, but the size of the move depends on longevity and discounting: with female mortality and no discounting the best age stays 70, while at a 2% real discount rate it drops from 68 to 62. The value surface is also flat near the top — across every scenario in this study, less than 2.3% of lifetime value separates the best three claiming ages — so any single best age is really the middle of a range.
What is the tax torpedo and how big is it?
Under the IRS Publication 915 phase-in (https://www.irs.gov/publications/p915, checked 2026-09-10), each extra dollar of other income can pull 50 or 85 cents of Social Security benefits into taxable income. Under actual 2026 single-filer bracket-and-deduction math, this study measures effective marginal rates of 15% to 22.2% on other income of $20,000 to $40,000 — versus statutory rates of 10% and 12% at those income levels. At $0 of other income the 2026 standard and age-65-plus deductions absorb the entire taxable share, so the benefit goes untaxed; once 85% of benefits is taxable at every claiming age (at $60,000 of other income in this grid), the marginal rate reverts to the statutory bracket.
How can I model my own numbers?
The free Social Security claiming-age calculator lets you enter your own benefit and birth year and compare claiming ages under scheduled benefits and under the 2033 projection, and the 2033 reduction calculator sizes the projected reduction itself. Both run in the browser with no signup.
Published 2026-07-09, updated 2026-09-07 with the answer-first summary (data unchanged), by QuantCalc Research. Educational research, not financial advice. Related: what the 2033 reduction does to retirement success (Monte Carlo) · claiming at 62 and investing the checks (Monte Carlo) · 2033 reduction calculator.