80.0% → 66.2% For a balanced 60/40 retiree who draws half of their spending from Social Security, a ~21% benefit cut starting in 2034 lowers the 30-year success rate from 80.0% to 66.2% — a 13.8 percentage-point drop. Offsetting it would take roughly $111,101 more saved at retirement.
The question
The Social Security Trustees project that the Old-Age and Survivors Insurance trust fund reserves will be depleted around 2033. If Congress does not act, continuing payroll taxes would fund only about 79% of scheduled benefits — roughly a 21% reduction. Most coverage frames this as a policy story. We asked a planning question instead: how much does that cut actually move the odds that a retirement plan survives, and how much extra savings would cancel it out?
The plan we tested
We model a household retiring at 65 in 2026 with a real spending need of $60,000 per year over a 30-year horizon. A portion of that spending comes from Social Security; the rest is funded by a portfolio sized to the classic 4% guideline on that initial gap. In the baseline, scheduled benefits continue. In the cut scenario, Social Security drops to 79% of scheduled — a ~21% cut — beginning in 2034, the eighth year of this retirement. Everything else is held identical, so the only thing changing is the benefit cut.
Result 1: the success-rate hit
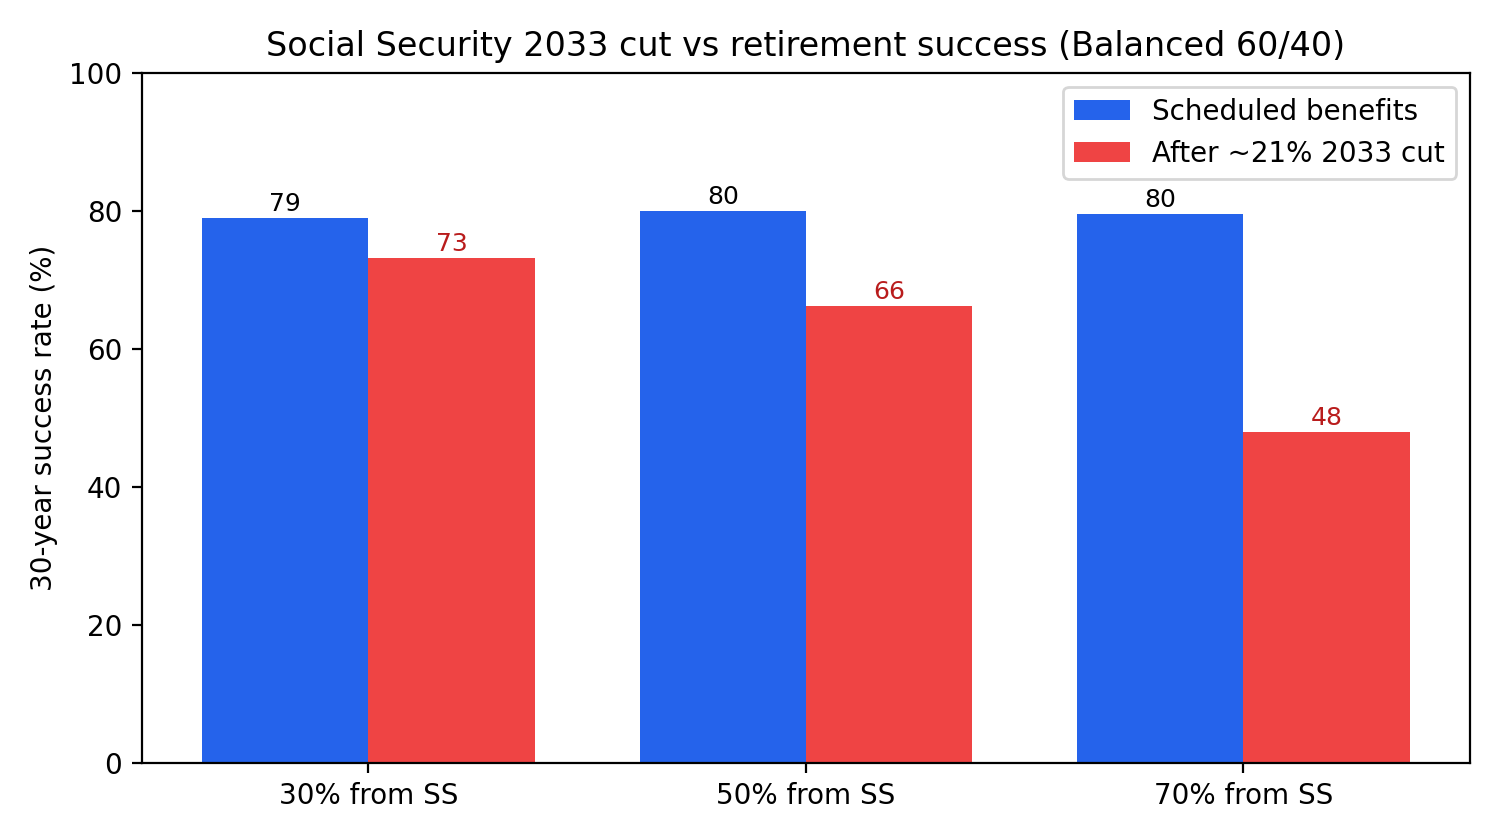
The more of your spending Social Security covers, the more a cut hurts. For the balanced 60/40 portfolio:
| Share of spending from SS | Success, scheduled | Success, after cut | Drop | Extra savings to offset |
|---|---|---|---|---|
| 30% | 78.9% | 73.2% | −5.8 pp | $61,728 |
| 50% | 80.0% | 66.2% | −13.8 pp | $111,101 |
| 70% | 79.5% | 47.9% | −31.6 pp | $157,392 |
Result 2: the savings needed to offset it
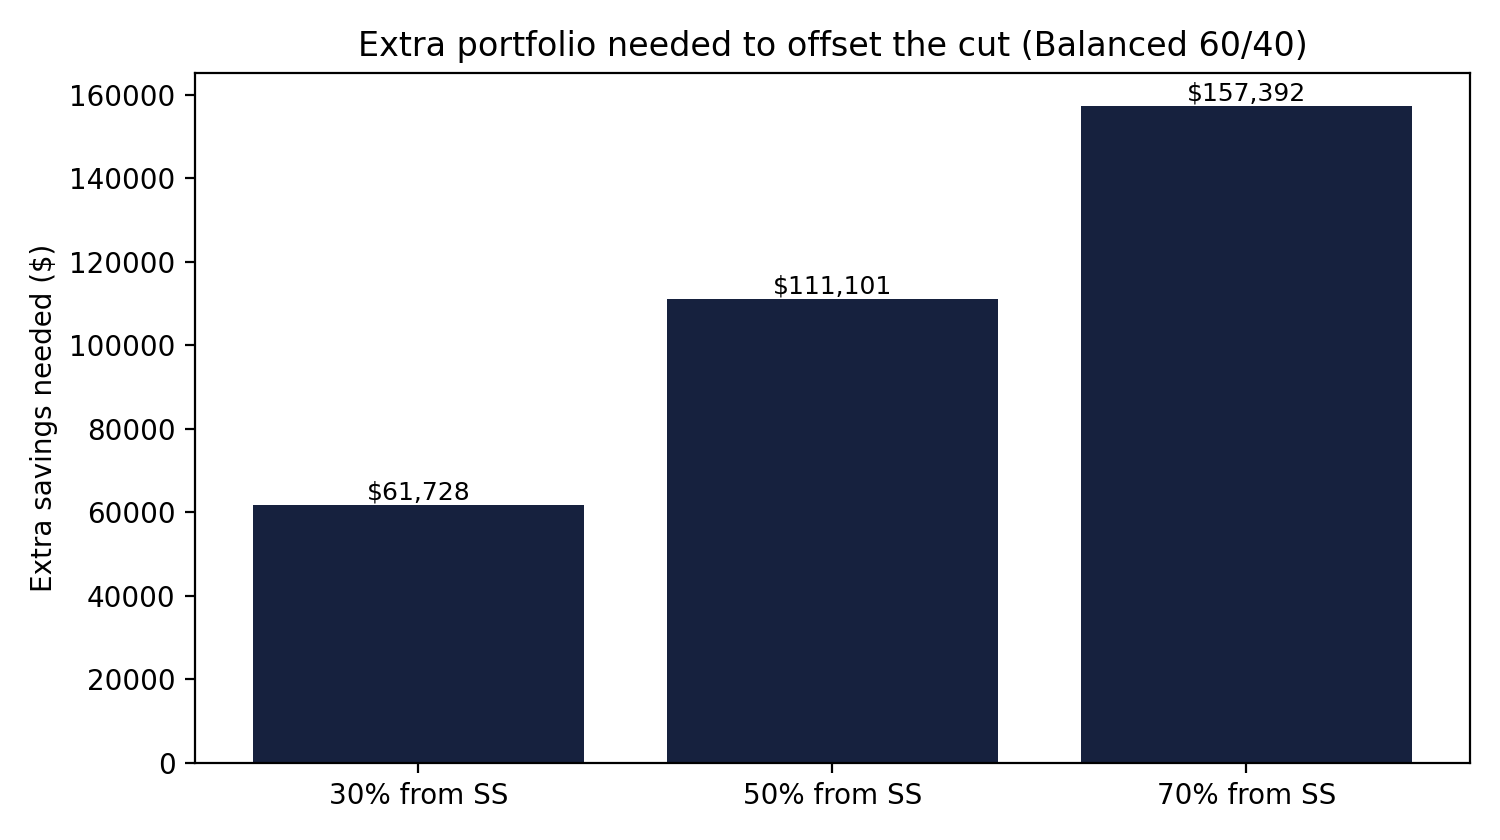
Restoring the pre-cut odds is a matter of more capital. A retiree more dependent on Social Security needs a larger buffer because a 21% cut removes more of their guaranteed income.
Every allocation and reliance level
| Allocation | SS share | Portfolio | Scheduled | After cut | Drop | Offset |
|---|---|---|---|---|---|---|
| Conservative (2% real, 6% vol) | 30% | $1,050,000 | 63.8% | 50.4% | −13.4 pp | $63,858 |
| Conservative (2% real, 6% vol) | 50% | $750,000 | 63.6% | 34.5% | −29.1 pp | $108,442 |
| Conservative (2% real, 6% vol) | 70% | $450,000 | 64.4% | 9.9% | −54.6 pp | $153,318 |
| Balanced 60/40 (4% real, 11% vol) | 30% | $1,050,000 | 78.9% | 73.2% | −5.8 pp | $61,728 |
| Balanced 60/40 (4% real, 11% vol) | 50% | $750,000 | 80.0% | 66.2% | −13.8 pp | $111,101 |
| Balanced 60/40 (4% real, 11% vol) | 70% | $450,000 | 79.5% | 47.9% | −31.6 pp | $157,392 |
| Equity-tilted (6% real, 16% vol) | 30% | $1,050,000 | 81.9% | 78.4% | −3.5 pp | $62,896 |
| Equity-tilted (6% real, 16% vol) | 50% | $750,000 | 82.3% | 73.5% | −8.9 pp | $121,698 |
| Equity-tilted (6% real, 16% vol) | 70% | $450,000 | 81.5% | 61.2% | −20.3 pp | $151,633 |
What it implies for retirees
- The cut is a portfolio problem, not just a benefits problem. Its real cost is the higher withdrawal it forces on your investments after 2034.
- Reliance is the risk factor. The more of your plan rests on Social Security, the more a cut matters — and the more an extra savings buffer is worth.
- You can size the buffer now. The offset column turns an abstract policy risk into a concrete savings target you can plan around.
Model the 2033 cut in your own plan
Free: enter your benefit in the Social Security 2033 cut calculator, or stress-test the cut inside a full 10,000-path Monte Carlo retirement plan — no signup.
Open the 2033 cut calculator →Methodology
Monte Carlo over normal real investment returns by allocation regime — conservative (2% real, 6% volatility), balanced 60/40 (4% real, 11%), and equity-tilted (6% real, 16%) — with 10,000 return paths per cell. Spending is withdrawn at the start of each year; the remainder grows by that year's real return. A path "fails" if the portfolio is exhausted before the 30-year horizon ends. Social Security is treated as real (inflation-indexed) income; in the cut scenario it falls to 79% of scheduled from 2034. Portfolios are sized to a 4% withdrawal on the initial income gap so that only the benefit cut differs between scenarios. The ~21% figure and the 2033 depletion date follow the Social Security Trustees' projections.
Reproducibility
The full per-cell results are published as open data under a CC0 public-domain dedication: results.csv and summary.json. The simulation is seeded (seed 20260701) and deterministic. See our methodology for the shared return-model assumptions used across QuantCalc research.
FAQ
Will Social Security really be cut in 2033?
Not automatically, and not today. The Social Security Trustees project that the Old-Age and Survivors Insurance trust fund reserves will be depleted around 2033. If that happens and Congress does not act, continuing payroll-tax revenue would cover roughly 79% of scheduled benefits — about a 21% across-the-board reduction. Congress has historically acted before such deadlines, but the shortfall is real and worth planning for.
How much does the cut lower retirement success?
In our Balanced 60/40 base case, a retiree drawing half their spending from Social Security sees their 30-year success rate fall from 80.0% to 66.2% — a 13.8 percentage-point drop — when the ~21% cut takes effect in 2034. The more of your retirement income comes from Social Security, the larger the hit.
How much extra would I need to save to offset it?
For that same base case, restoring the original success rate took about $111,101 of additional starting portfolio in the simulation. The full table shows the figure for every allocation and reliance level.
Who is most exposed?
Retirees who rely on Social Security for a larger share of their spending, and those with more conservative portfolios that have less growth to absorb a higher withdrawal after 2034. Higher-income retirees with large portfolios are less affected in percentage terms because Social Security is a smaller part of their plan.
Can I model my own numbers?
Yes. The free Social Security 2033 cut calculator lets you enter your own benefit and time horizon, and the full Monte Carlo planner lets you stress-test the cut inside your complete retirement plan.
Published 2026-07-01 by QuantCalc Research. Educational research, not financial advice. Related: when to claim Social Security (Monte Carlo) · 2033 cut calculator · Social Security & IRMAA.