The 2026 retirement tax numbers, on one page
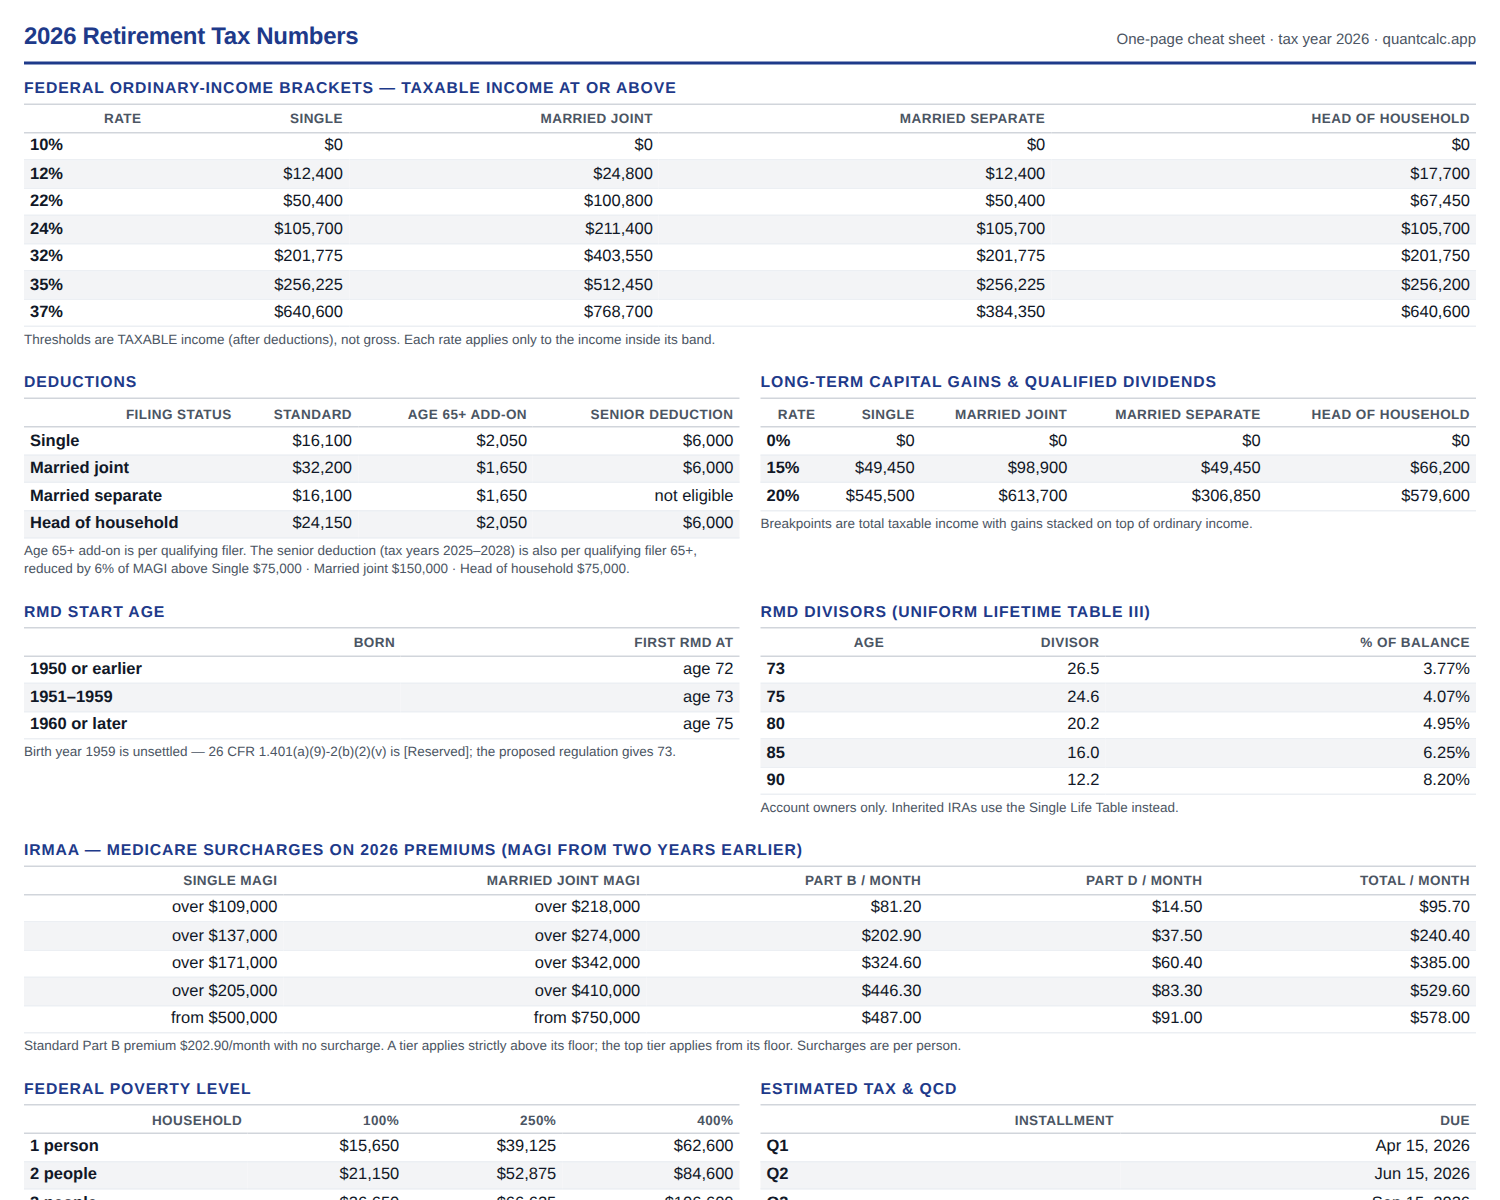
Brackets, deductions, capital-gains breakpoints, RMD ages and divisors, IRMAA tiers, poverty levels, the QCD cap and the estimated-tax calendar — printed small enough to sit inside a folder and read without scrolling.
Free. Every figure is read straight from the constants our calculators run on, so the sheet and the tools always say the same thing.
What is on the sheet
- Federal ordinary-income brackets — all four filing statuses
- Standard deduction, the age-65 add-on, and the senior deduction with its phase-out
- Long-term capital-gains and qualified-dividend breakpoints
- RMD start age by birth year
- Uniform Lifetime divisors at ages 73, 75, 80, 85 and 90
- IRMAA tiers for single and married-joint, Part B and Part D
- Federal poverty level at 100%, 250% and 400%, households of 1 to 4
- QCD annual cap and the one-time split-interest cap
- The four estimated-tax due dates and the current underpayment rate
What it looks like
Get the sheet
Thanks — here it is.
Open the 2026 cheat sheetPrint it with Ctrl-P (Cmd-P on a Mac) — it is laid out to land on one page. We will email you the 2027 edition when the IRS publishes next year's figures.
Rather not leave an address? Just open the sheet — same file, no email needed.
Where the numbers come from. The sheet is generated from the same constants library the QuantCalc calculators compute with, so nothing on it is retyped by hand. Its footer carries the citation for every family: Rev. Proc. 2025-32 for the brackets and deductions, Pub. L. 119-21 §70103 for the senior deduction, IRS Notice 2025-67 for the QCD caps, 26 CFR 1.401(a)(9)-9 for the Uniform Lifetime Table, the CMS premium notice for IRMAA, and IRC §§6621 and 6654 for the estimated-tax calendar. For planning, not tax advice.